Three Example Strategies for Different Risk Profiles
The abstract case for a rule-based strategy is easy to make. The concrete case is much harder, because “a rule-based strategy” can mean almost anything — from a single-line rule that shifts to cash above a threshold, to a multi-zone playbook with a dozen ETFs. So instead of another abstract argument, this post walks through three worked examples: one conservative, one balanced, one aggressive. Each one is a complete, runnable strategy — with the actual PortfolioLab backtest attached.
A word on framing before we start. These are examples, not recommendations. They exist to show you what the shape of a real rule-based portfolio looks like, and how the same underlying idea changes when you dial the risk up or down. You will almost certainly want to adapt any of them — different ETFs, different zones, different weights — to fit your own goals, regulatory situation, and, most importantly, what you’ll actually hold through a drawdown. Which one is “right” for you is not a question this post can answer.
What makes a strategy conservative, balanced, or aggressive
The three risk profiles are shorthand for what each strategy prioritises on the return-vs-drawdown trade-off:
- Conservative — chooses assets designed for lower volatility and shallower drawdowns. Consequently accepts lower long-term returns. The kind of strategy an investor near retirement, or drawing income, would sleep with.
- Balanced — aims for something close to S&P-like returns in bull markets — during certain periods a little less, because it steps out into short-term safety when stress rises. A pragmatic middle for a long-horizon investor who still wants a real floor. Uses tail-hedge components in crisis.
- Aggressive — stays in offensive positions longer and uses leverage to boost returns during bull markets. Higher expected long-term returns, but also deeper drawdowns along the way. Also uses tail-hedge components in crisis, aimed at capitalising on the worst moments.
Every risk profile is a choice about which pain you’d rather take. Conservative accepts underperformance in bulls to avoid deep losses. Aggressive accepts more losses along the way to capture the bulk of bull-market returns. Neither is wrong. Both have their time and place.
All three of the strategies below use the same three-zone skeleton, with thresholds set on the Tactical Investing Fear Index percentile: an offensive zone where the market is calm and the strategy runs its return engine, a conservative zone where stress has begun and the strategy rotates into stable assets, and a crisis zone at the extreme where the strategy steps out entirely or into a dedicated tail hedge. What differs across the three is which return engine, which stable assets, and what tail hedge — plus, for Aggressive, a slightly higher offensive threshold.
All three backtests below run over the same period: January 2015 through July 2026. Long enough to include the 2020 crash and the 2022 rate-hike cycle; short enough that no one strategy has been tuned to a single ancient regime. (For a full walk-through of how to read backtest numbers honestly — and how to spot when a curve is too good to be true — see overfitting: why a perfect backtest curve is a warning sign.)
Strategy A — Conservative
The goal. Reduce drawdowns first, participate in equity upside second. Sleep well through every drawdown of the last decade.
Universe. Vanguard All-World Minimum Volatility ETF, iShares Global Utilities ETF, cash.
Zones and weights.
- Offensive (Fear Index 0–60%) — 100% Vanguard All-World Minimum Volatility ETF. Captures the equity uptrend while dampening drawdowns by construction — the ETF is designed to hold less-volatile names.
- Conservative (Fear Index 60–97%) — 100% iShares Global Utilities ETF or 100% Vanguard All-World Minimum Volatility ETF, depending on the current monetary regime. Utilities tend to do well when central banks are easing (rates falling; their bond-like character is rewarded); the minimum-volatility ETF fits better when rates are tightening (less sensitive to duration risk). The strategy uses whichever fits the regime you’re in.
- Crisis (Fear Index 97–100%) — 100% cash. Steps out of the market entirely at the extreme.
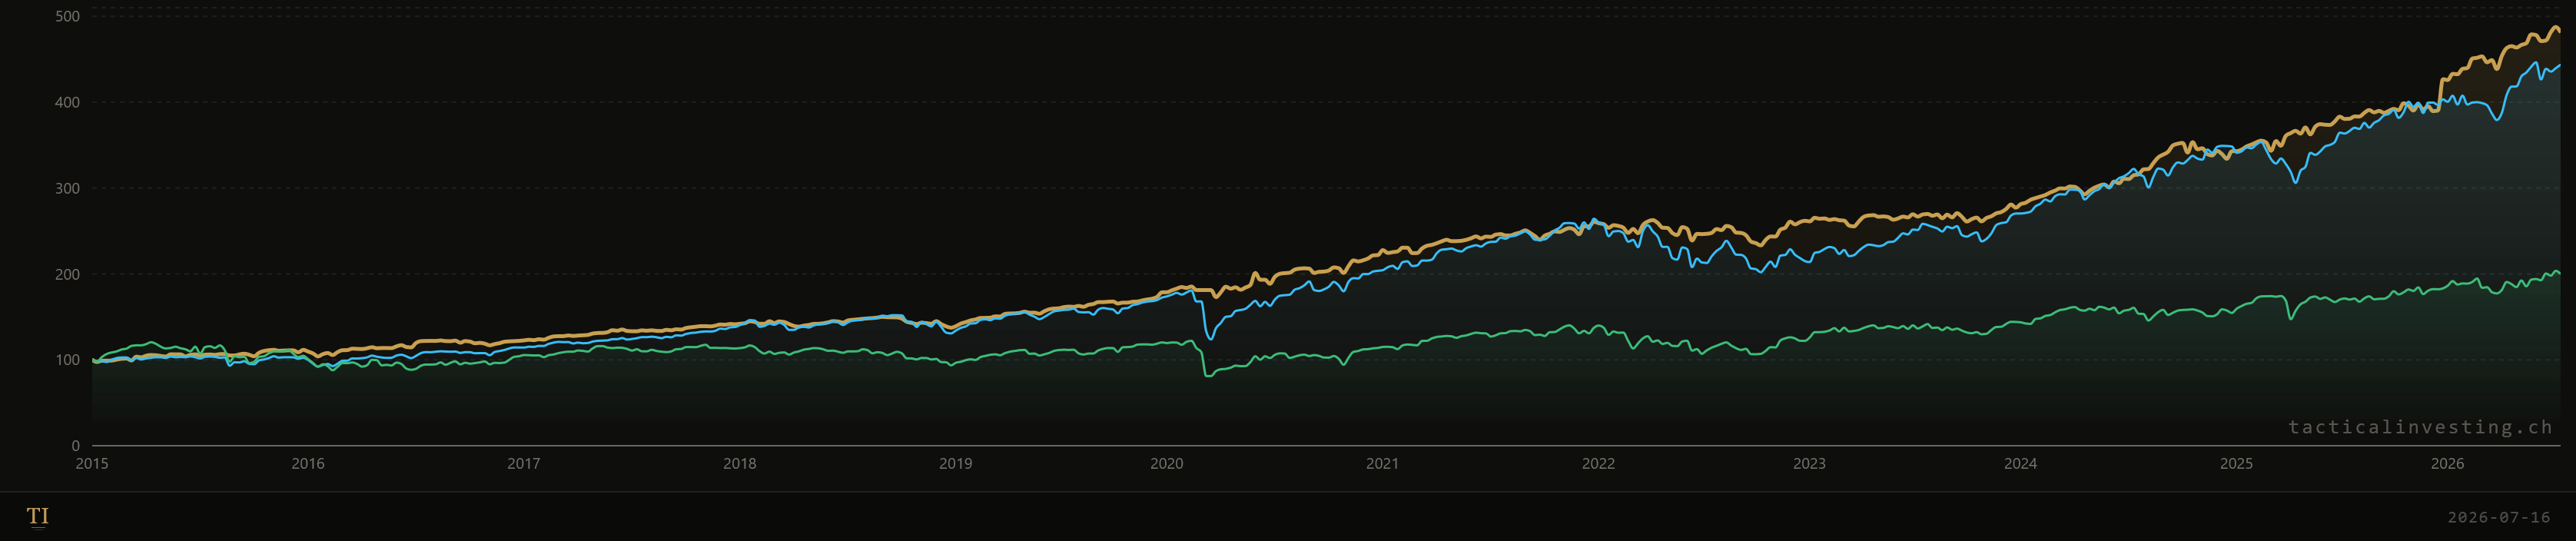
Yellow: the Conservative strategy. Blue: S&P 500. Green: STOXX 50.
What the backtest shows.
- CAGR 14.7% • Max Drawdown -12.0% • Sharpe 1.33
- vs SPY buy-and-hold over the same period: CAGR 13.9% with Max Drawdown -33.7%
- Behaviour in 2020 and 2022: the strategy stayed close to flat through both periods. The Fear Index rotation moved out of the offensive sleeve early enough to avoid the sharp drawdowns, without producing meaningful gains on the way back either.
Honest read. Conservative strategies almost never win the return race in a stretch like 2016–2019 — you’ll leave meaningful money on the table versus full equity exposure. The trade you’re accepting is that over a full cycle including at least one bad year, your drawdown floor is much shallower than buy-and-hold. If you’d struggle emotionally with a -20% drawdown, this profile buys you the ability to stay invested when a less-defensive strategy would force you out. And over the long term — as this backtest suggests — the strategy can keep up with most indices while running at a fraction of their drawdown risk. Whether that pattern continues is not something a backtest can promise, but the shape of the trade-off is honest.
Strategy B — Balanced
The goal. Something close to S&P-like returns in bull markets, with meaningful drawdown protection in stress and a dedicated tail hedge in crisis. A workable middle for a long-horizon investor who still wants a real floor.
Universe. Berkshire Hathaway (BRK.B), US Real Estate ETF, US Minimum Volatility ETF, VIXM (long-volatility ETN), cash.
Zones and weights.
- Offensive (Fear Index 0–60%) — 100% Berkshire Hathaway. A diversified holding company whose long-term equity-like return profile serves as the return engine.
- Conservative (Fear Index 60–97%) — 100% US Real Estate ETF or 100% US Minimum Volatility ETF, chosen by the current monetary regime. Real estate takes the easing side here — it’s the rate-sensitive asset that plays the role utilities played in Strategy A. Minimum-volatility fits the tightening side, less exposed to duration risk.
- Crisis (Fear Index 97–100%) — 50% VIXM (long volatility) / 50% cash. A modest tail hedge paired with cash — the vol sleeve aims to gain during the sharpest equity drawdowns while cash preserves the rest.
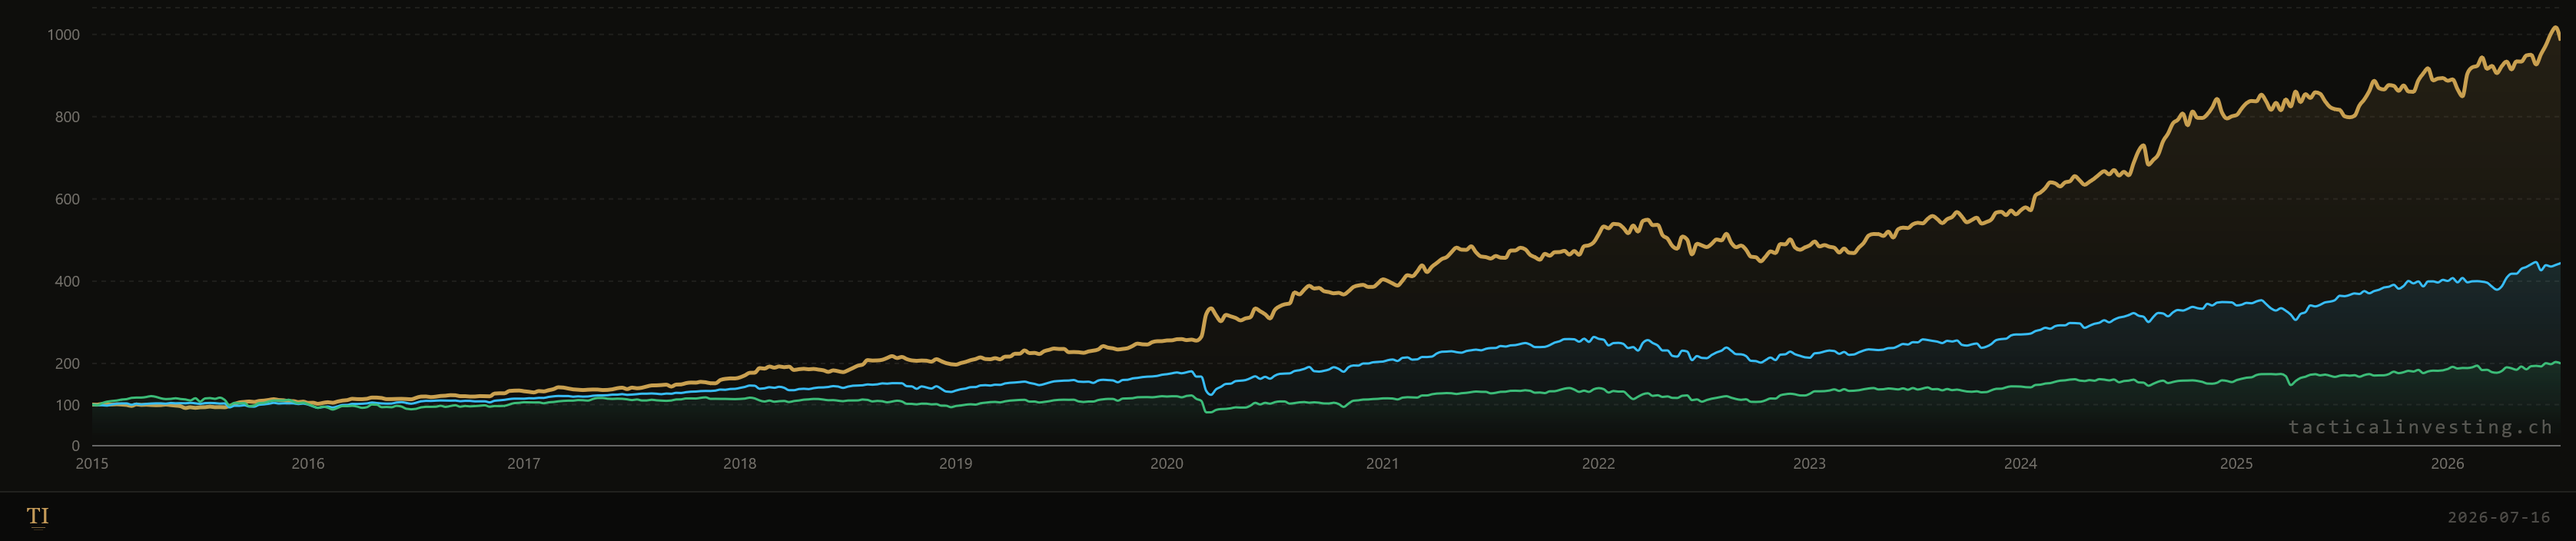
Yellow: the Balanced strategy. Blue: S&P 500. Green: STOXX 50.
What the backtest shows.
- CAGR 16.2% • Max Drawdown -19.2% • Sharpe 1.12
- vs SPY buy-and-hold over the same period: CAGR 13.9% with Max Drawdown -33.7%
- Behaviour in 2020 and 2022: close to flat in 2020, and slightly negative in 2022.
Honest read. In an uninterrupted bull, straight SPY often edges this out on total return, because Balanced spends part of its life in Real Estate or Minimum-Vol rather than a broad market. The value shows up in the drawdown line: -19% here versus a -34% for buy-and-hold, at similar (in fact slightly higher) CAGR. It’s worth naming a limit honestly — over the last few years the total return of this Balanced strategy has been close to the Conservative one, mostly because the bull market has been unusually strong and Balanced has spent meaningful time in defensive assets. In a more ordinary bull, we’d expect Balanced to pull further ahead of Conservative on return while still preserving a real floor. Whether that expectation is right is exactly the kind of thing you should stress-test yourself before relying on it.
Strategy C — Aggressive
The goal. Maximise long-term expected return by using leverage on the offensive side and staying in offensive positions longer, with a genuine tail hedge that only activates when things break. Higher expected returns, meaningfully deeper drawdowns along the way — not for the faint-hearted, but still meaningfully better on both return and worst-case drawdown than a plain leveraged buy-and-hold, at least in this backtest.
Universe. A leveraged Nasdaq ETF, US Utilities ETF, US Minimum Volatility ETF, VIXM.
Zones and weights. Note the wider offensive band — this strategy stays in the return engine up to Fear Index 70, not 60:
- Offensive (Fear Index 0–70%) — 100% Leveraged Nasdaq ETF. Leverage amplifies both the return in bull markets and the drawdown in downturns. The wider offensive band means this position is held through more of the market-stress spectrum than the other two strategies.
- Conservative (Fear Index 70–98%) — 100% US Utilities ETF or 100% US Minimum Volatility ETF, chosen by the current monetary regime.
- Crisis (Fear Index 98–100%) — 100% VIXM. A concentrated tail hedge — designed to gain in exactly the events that hurt a leveraged position most.
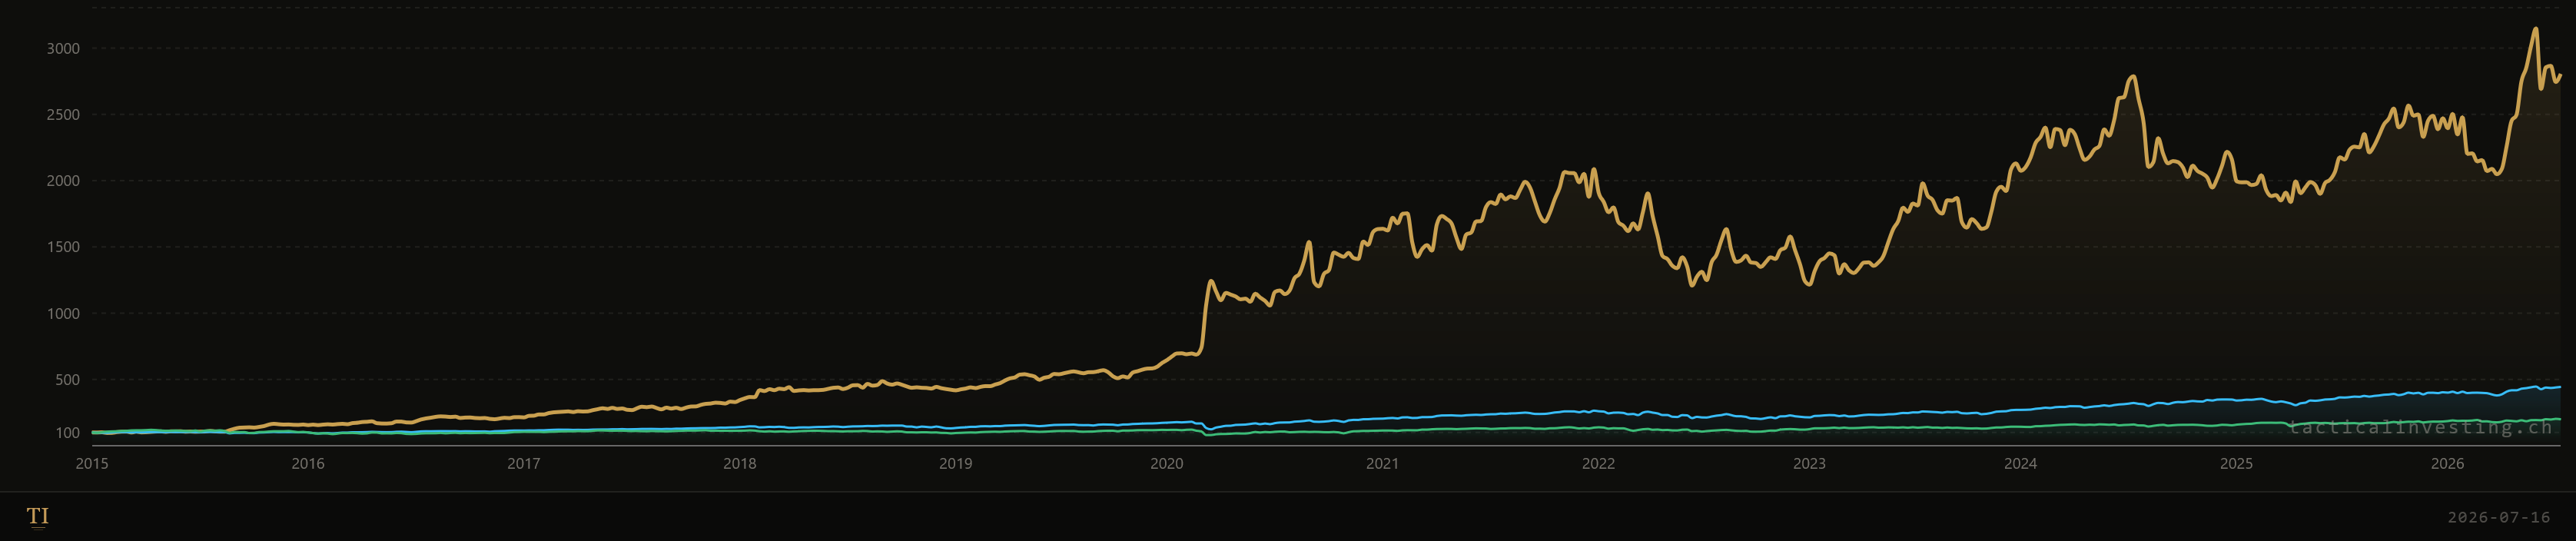
Yellow: the Aggressive strategy. Blue: S&P 500. Green: STOXX 50.
What the backtest shows.
- CAGR 33.7% • Max Drawdown -43.9% • Sharpe 1.05
- vs 100% Nasdaq buy-and-hold over the same period: CAGR 31.1% with Max Drawdown -63.7%
- Behaviour in 2020 and 2022: +162.6% in 2020 — the leveraged Nasdaq sleeve caught the sharp recovery from the COVID low. -38.1% in 2022 — largely because the rotation out of the leveraged offensive position happened later than it needed to. Both results — the outperformance and the loss — are exactly the shape the aggressive design produces.
Honest read. Leverage cuts both ways. In a decade like the 2010s an Aggressive strategy meaningfully outperforms buy-and-hold — that’s the entire point of using leverage. The other side of that bargain is worse-case drawdowns, and a tail hedge that’s designed to help at the extreme but that costs the strategy something during less-catastrophic stress. Timing tail-risk positions is notoriously hard: you will be wrong more often than you will be right, and the point of the design is that the right times have to compensate the wrong times significantly. If they don’t, the tail hedge is dead weight. This profile is only honest for investors whose horizon and temperament genuinely tolerate that trade — including the possibility that in any given decade, the leveraged offensive engine could go through a stretch that a buy-and-hold investor simply would not have. That is exactly why running an Aggressive strategy on its own is rarely wise: the practical answer is to combine several uncorrelated strategies with different purposes into a portfolio, so the ugly stretches of one are cushioned by the calm ones of another. Combining strategies into a portfolio — blend or diversify? covers what the resulting blend actually looks like on real data.
These are templates, not endpoints
The three profiles above aren’t finished products — they’re skeletons. The most useful move from here isn’t to pick the one that fits and copy it; it’s to treat them as starting shapes and adapt in three ways.
Adapt the underlying assets to your view. The Conservative skeleton works whether the offensive sleeve is a global minimum-volatility ETF, a US-focused equivalent, or a value-tilted one. The Aggressive skeleton works whether the offensive engine is a leveraged Nasdaq, a broad-market equivalent, or a sector-tilted one. What matters isn’t the specific ticker — it’s the shape of the offensive → conservative → crisis rotation. Swap in the ETFs you actually understand, hold conviction in through a full cycle, and fit your investor identity. Take the thinking seriously: why did this ETF perform well in the past, and does that reason still hold going forward? A ticker that ran on a decade-long tailwind may not run on the next one.
Combine, don’t just pick. A single strategy is a single bet on one risk profile. Real portfolios often behave better when they weight two or three of these profiles together — some capital in Conservative, some in Balanced, some in Aggressive — so the drawdowns and returns of the whole are smoother than any of the parts. How to combine strategies into a portfolio, and what the resulting blend actually looks like, is covered in combining strategies into a portfolio — blend or diversify?.
Reassess as the world changes. No strategy is meant to sit unchanged for a decade. Central-bank cycles shift, dominant sectors rotate, the ETFs that fit your view today may not fit it in five years. A quarterly re-read of your own thesis — US focus vs All-World, tech and growth vs value, leverage still yes or now no — is normal and healthy. Rule-based investing isn’t set-and-forget; it’s set, run, review, refine.
The takeaway
These three profiles cover the honest range for a retail investor who wants a rule-based approach: from capital-preservation-first, through S&P-adjacent with a floor, to leveraged with a tail brake. None of them is optimal for everyone; each is a starting template. The value of running them yourself, with your own inputs, is that the trade-offs stop being abstract and start being visible on your own equity curve.
If you haven’t built a strategy in PortfolioLab yet, how to build your first strategy walks through the mechanics step by step. Before you interpret the backtest output, what a backtest actually tells you covers the metrics that matter and the warning signs of overfit. And if you’re still weighing whether a rule-based approach is right for you at all, buy-and-hold vs tactical investing sets out both sides honestly.
For educational purposes only — not financial advice.