Combining Strategies into a Portfolio — Blend or Diversify?
The most natural next question after building one rule-based strategy is: should I be running more than one? A single strategy is a single bet — on one set of rules, one asset universe, one interpretation of what the Fear Index is telling you. Real portfolios often behave better when they’re not that concentrated. But how combining strategies actually helps — and where it quietly doesn’t — is worth being honest about before you split your capital across three of them.
This post walks through what changes when you combine strategies into a portfolio: the two different reasons to do it, the cases where blending genuinely smooths the ride, and the cases where it just averages the risk without diversifying anything. It’s the natural follow-up to three example strategies for different risk profiles, which introduced the profiles this post will build on.
Two different reasons to combine
People combine strategies for two very different reasons, and the confusion between them is where most of the disappointment comes from.
Reason one: reach a risk profile that no single strategy hits. If Conservative feels too cautious and Balanced feels too exposed, a 50/50 blend of the two sits in between — a bespoke risk level built out of two existing ones. This is blending. It’s straightforward, it works, and it’s often the correct move for an investor who doesn’t fit neatly into one of the pre-defined profiles.
Reason two: reduce the risk that a single strategy fails. Even a well-designed rule set can go through years of underperformance — a threshold that was well-chosen for the last decade might be less well-suited to the next. Running two strategies together means the ugly stretches of one can be cushioned by the calm stretches of the other. This is diversifying — and unlike blending, it only works if the strategies are genuinely different in the ways that matter.
Both are legitimate. But they solve different problems, and combining strategies naively — say, “I’ll run two strategies 50/50, both using the Fear Index at similar thresholds” — mostly does the first (blend to a middle risk level) while people often think they’re doing the second (diversify against failure). Naming which one you’re actually after keeps the decision honest.
When combining actually smooths — and when it just averages
The mechanical answer is straightforward. If you run two strategies at 50% weight each and rebalance daily, the return of the combined portfolio is exactly the weighted average of the two returns, day by day. In practice you rebalance less often — every time a component strategy makes a trade, rather than on a fixed calendar (see the practical section further down) — so weights drift slightly between rebalances and the arithmetic loosens up a bit. The mental model still holds. What’s interesting is what happens to the drawdowns and to the risk-adjusted return — and that’s where correlation does the work.
The rule of thumb worth carrying:
- Perfectly correlated strategies — same rules, same signals, same assets, same days moving in the same direction — combining changes nothing except the label on the account. The blend has the same drawdown depth and the same Sharpe as either strategy alone.
- Partially correlated strategies — some overlap in signals or assets, but real differences in when and how they react — the blend’s drawdown is typically shallower than the weighted average of the individual drawdowns. Sharpe often improves. This is the honest diversification benefit, and it’s the case most real strategy portfolios sit in.
- Uncorrelated strategies — the returns move independently — the drawdown floor rises substantially and the ride gets meaningfully smoother. Rare in practice but disproportionately valuable when you find it.
- Negatively correlated strategies — one is up when the other is down — the strongest possible smoothing effect, but often at the cost of long-run return. Also rare; usually the negatively-correlated leg is a hedge, and hedges are best designed inside a single strategy (as the crisis-zone position) rather than added as a separate portfolio leg. That’s exactly what the tail-hedge zone in the example strategies is doing, and the same logic behind when hedging actually pays off.
The trap: two strategies that look different on paper can share the same underlying signal. If the Conservative and Aggressive examples from the example strategies post both use the Tactical Investing Fear Index at similar thresholds, they will step out of their offensive positions on the same day — not because that’s a coincidence, but because they’re reading the same weather report. The 50/50 blend of the two is closer to “one strategy at a medium risk level” than it is to “two independent strategies”. You get the blend benefit, but not much of the diversification benefit.
Real diversification between Fear-Index strategies comes from one of three things, all of which the tool actually supports:
- Different Fear Index versions. The Tactical Investing Fear Index comes in two regional versions — US and European — both built on the same 0–100 logic but reading different underlying markets and finalised at different times of day. A strategy built on the US signal will step in and out on different days from one built on the EU signal, because European and US market stress don’t move in perfect lockstep. That’s the cleanest form of diversification the tool ships.
- Different assets in the same Fear-Index zones. Even with the same signal and the same thresholds, a strategy whose offensive engine is a leveraged Nasdaq ETF will behave very differently from one built around Berkshire Hathaway, and both will behave differently from a minimum-volatility approach. Combining strategies with the same skeleton but different asset choices per zone diversifies the asset risk even when the signal is shared. This is why the three profiles in the example strategies post are useful together, not just individually.
- Different number of zones. A three-zone strategy trades less often than a five-zone one (more zones means more rotation points). Combining a coarser rotator with a finer one produces different entry days, different fill prices, and different responsiveness to mid-range Fear Index readings. Keep the total number of zones per strategy at five or below — beyond that you’re mostly adding noise, not signal.
Even one of these three, done properly, gets you meaningful diversification. Two or three together is what a diversified Fear-Index strategy portfolio actually looks like.
What a real blend actually looks like
Take two of the strategies from the example strategies post — Conservative (CAGR 14.7%, Max Drawdown -12.0%, Sharpe 1.33) and Aggressive (CAGR 33.7%, Max Drawdown -43.9%, Sharpe 1.05). Run them 50/50 across the same 2015–2026 window, with rebalancing on every trade event (see the practical section below).
The blend delivers CAGR 25.3%, Max Drawdown -28.7%, Sharpe 1.24 over the period.
The result sits between its two components on every dimension: return closer to Aggressive than to Conservative; drawdown clearly shallower than Aggressive alone (-28.7% vs -43.9%) but deeper than Conservative on its own (-12.0%); a Sharpe that lands between the two. The chart below shows the equity curves side by side — the yellow line is what the blend actually did.
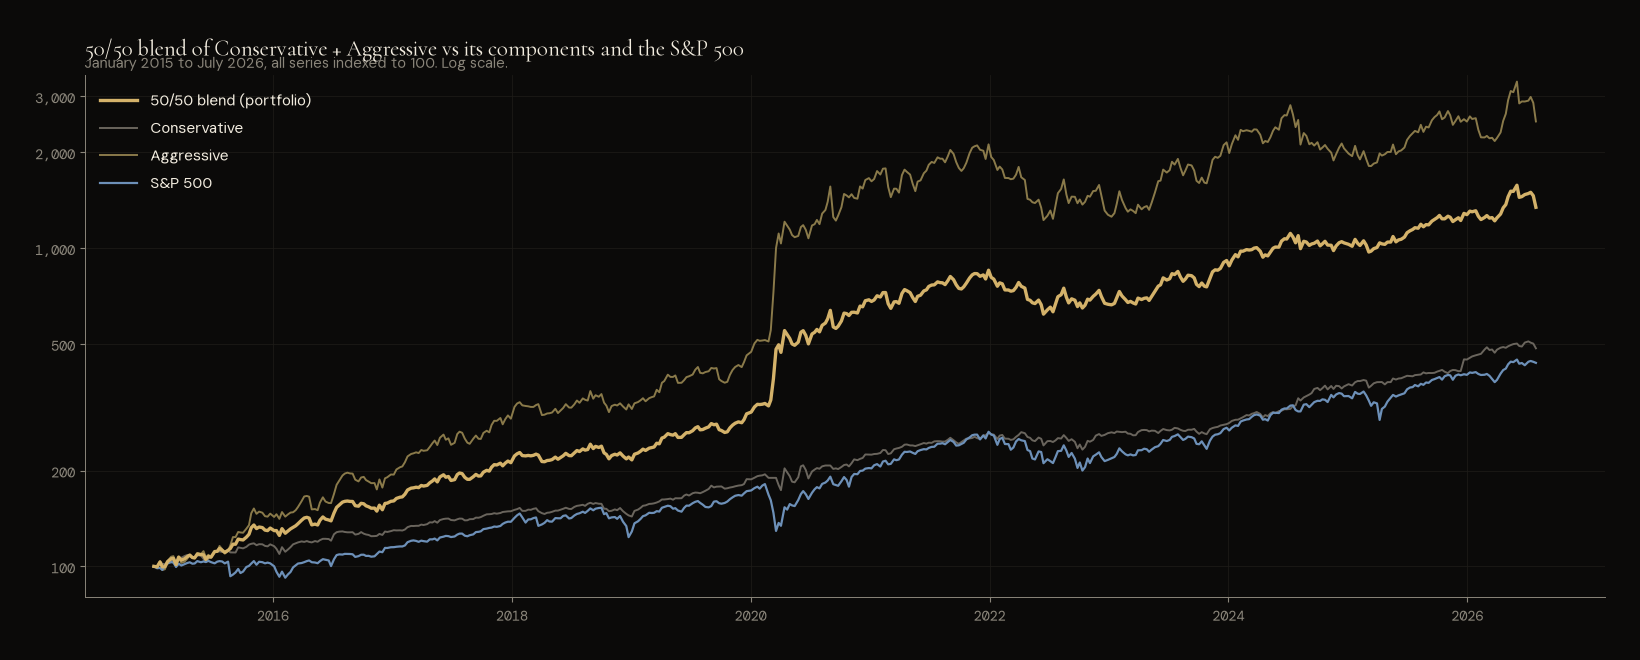
Yellow: the 50/50 Conservative + Aggressive blend. Blue: S&P 500. Muted olive: Aggressive. Muted grey: Conservative. All indexed to 100 at the start; log scale. The blend sits between its two components on the equity curve — with a smoother path than the Aggressive line’s ride to get there.
This is the honest shape of combining two strategies that share the Fear Index signal — you smooth the ride versus the more volatile leg, at the cost of some of its upside. Pair strategies that differ more sharply — one built on the US Fear Index and one on the EU version, or one with a leveraged offensive engine and one with a minimum-volatility one — and the smoothing gets more pronounced.
Practical mechanics in PortfolioLab
The tool itself makes this straightforward: build each strategy as its own object, then combine them in the portfolio builder with the weights you want. A few things worth knowing before you set it up.
Weights should reflect the risk you want, not the return you want. Nudging toward “more Aggressive” because you liked its backtest is a well-worn way to buy a drawdown you didn’t intend. Set the weights against the drawdown you’d be willing to hold through, not the CAGR you’d like to see. The drawdown numbers of the blend tell you how the portfolio will behave; the CAGR is a byproduct of that behaviour, not the input to it.
Rebalancing runs on trade events, not on the calendar. Whenever a component strategy rotates between zones, the portfolio’s weights are reset back to target. Between those events, weights drift with the two strategies’ relative performance — usually mildly, sometimes noticeably during a long stretch without a trade. This is the honest, low-friction way to keep the target mix without generating unnecessary transactions. Setting a fixed calendar rebalance (quarterly, semi-annual) on top of that is not something the tool asks for by default, and usually not something you need — but if you strongly prefer one, nothing stops you.
Check the correlation before you commit. The portfolio-backtest view lists the pairwise correlation between the strategies you’re combining. Use it as your diversification-worked-or-not check: as a rough rule, if two strategies correlate above ~80% you’re paying extra complexity without meaningful smoothing — one of them is doing most of the work and you’d be better off running that one alone at a size that matches your target risk. Below 80% is where combining starts earning its keep; the lower the correlation, the more the drawdown line separates from the worst-performing leg.
Trade sizing beats trade cost on smaller portfolios. Trading fees at retail brokers today are usually low enough that the fee itself isn’t the concern. What can matter more, especially at modest capital, is trade sizing: some of the ETFs that anchor the offensive zones trade at high nominal prices, and a small percentage allocation on a small portfolio can round down to one or two shares — introducing rebalance imprecision that’s more noticeable than any fee. If that’s your setup, prefer ETF choices with lower per-share prices or increase your rebalance thresholds.
Track them separately as well as together. The whole point of combining is that individual strategies will have ugly stretches — that’s the entire logic. If you can only see the blended equity curve you’ll be tempted to swap out a strategy that’s underperforming right at the worst moment, which is exactly what a rule-based approach is supposed to prevent. The Live Tracker view in PortfolioLab lets you see both the portfolio and its component strategies at once, along with the contribution each is making to combined return and drawdown — which is where the discipline lives.
If you haven’t built a portfolio out of multiple strategies yet, how to build your first strategy covers the single-strategy mechanics; the multi-strategy portfolio view builds on the same objects. And before you interpret the blended backtest, what a backtest actually tells you is worth a re-read — the metrics you focus on for a portfolio of strategies should be the same ones you focus on for a single strategy, applied to the blend.
Reassess as you go — the portfolio isn’t set-and-forget either
A strategy portfolio deserves the same periodic honesty as an individual strategy. Central-bank regimes shift, correlations that were low become high, the signal that worked cleanly through one cycle can lose edge in the next. A yearly or half-yearly re-read of why each strategy is in your portfolio — is the diversification it was supposed to add still there, has its own thesis held up, does the weight still fit the risk you actually want — is the routine that keeps the portfolio honest.
Two specific things to watch:
- Correlation drift. Two strategies that were diversifying against each other in one regime can suddenly move in lockstep in another. 2022 was that kind of year for a lot of the classical hedging relationships. If your portfolio’s drawdown line starts tracking the worst-performing component too closely, correlation drift is often what’s happened — the portfolio-view correlation number is the first place to look.
- Weight drift, undetected. Rebalancing on trade events keeps the target mix honest most of the time, but a component strategy that’s genuinely broken (not just underperforming — actually failing at its stated purpose) will keep dragging on the portfolio until you notice. Rules-based investing is set, run, review, refine — for individual strategies, and for the portfolio as a whole.
The takeaway
No single strategy is guaranteed to keep working. No one has a crystal ball — and no backtest can prove otherwise (overfitting explains why). That’s exactly the argument for combining strategies rather than picking one and hoping. Combining is how a portfolio stops depending on any single rule set being right about the next decade.
Blending gets you to a bespoke risk profile that sits between the pre-defined ones. Diversifying — with different Fear Index versions, different assets in the same zones, or different numbers of zones, checked against a correlation ceiling — reduces the risk that any one leg fails at exactly the wrong moment. Both are worth doing, and doing them together is how the individual profiles from three example strategies for different risk profiles become an actual portfolio built for how you want to hold through the next cycle. The tool does the mechanics; the honest thinking about which combining you’re doing, and why, is yours to bring.
For educational purposes only — not financial advice.