The VIX Explained — What the Fear Gauge Really Shows
The VIX is the most-quoted number in finance that most investors cannot precisely define. It’s called “the fear gauge”, it’s on the front page every time markets fall hard, and its rough shape — low when markets are calm, high when they aren’t — is intuitive enough to feel understood. What it actually measures, and what it can and can’t tell you, is a different story.
This post walks through what the VIX is, how to read the numbers, the specific things it does not measure, and where it falls short as a complete signal of market fear.
What the VIX actually is
The VIX is Cboe’s index of expected 30-day volatility in the S&P 500, derived from the prices investors are paying for S&P 500 options. It is expressed as an annualised percentage. A VIX reading of 20 means the options market is currently pricing an annualised standard deviation of roughly 20% in S&P 500 returns over the next 30 days.
The intuition is simple. Options are, in effect, insurance on the index — a put option pays off if the market falls, a call option pays off if it rises. When investors expect a bumpy month, they pay more for that insurance, and richer option prices imply higher expected volatility. The VIX turns that willingness-to-pay into a single number. When it goes up, the market is paying more for protection.
Two things are worth being precise about. First, the VIX is a measure of expected volatility, not realised — it’s what the options market collectively thinks the next 30 days will look like, not what has just happened. Second, it is a measure of magnitude, not direction. A high VIX means the market expects big moves; it does not say whether those moves will be up or down. In practice, a rising VIX correlates with falling markets far more often than with rising ones — which is why it earned the “fear gauge” nickname — but that correlation is a pattern, not a definition.
How to read the numbers
VIX values move through several well-recognised ranges. None of these are official categories — the market doesn’t hand you a colour-coded scale — but the rough intuition matches what most practitioners carry in their head.
- Below 15 — calm regime. Options are cheap; the market expects a quiet month. Historically the median VIX reading has sat in this territory or just above it.
- 15 to 20 — normal. The default state of a functional market. Small swings, no panic, but options aren’t giveaway cheap either.
- 20 to 30 — elevated stress. Something has the market’s attention: an economic surprise, a geopolitical event, an earnings-season wobble. Insurance is getting more expensive.
- 30 to 40 — active crisis. Historically, moves through this range have accompanied genuine market drawdowns rather than shallow pullbacks.
- Above 40 — rare tail events. The VIX spends very little time up here across a full history. Most spikes above 40 are over in weeks, not months — though every so often they stay elevated longer than the news cycle suggests, and the tail can outlast the panic that caused it.
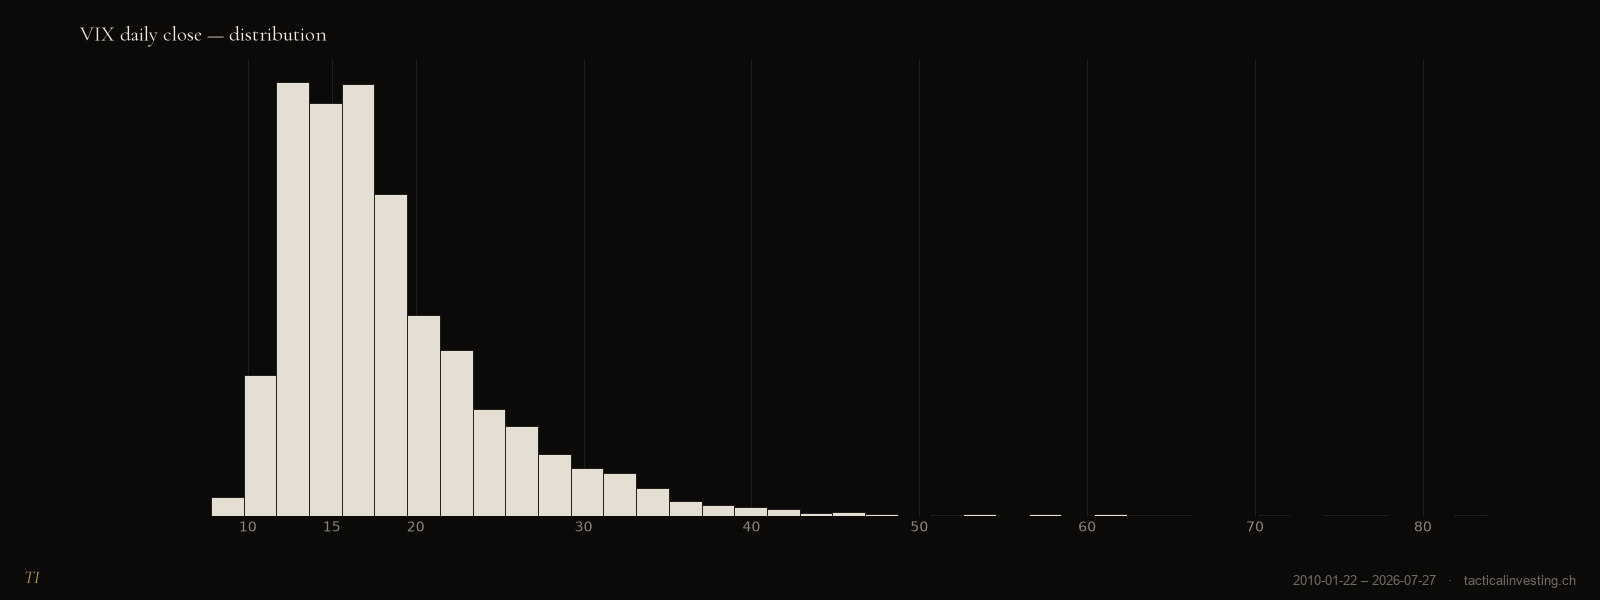
Distribution of daily VIX closes, 2010 – 2026. The vast majority of days sit below 25; readings above 40 are rare tail events.
The pattern most beginners get wrong is thinking of the VIX as linear. It isn’t. Doubling from 15 to 30 is a normal move — happens several times a year. Doubling from 30 to 60 is rare, violent, and typically over in a matter of days. The VIX’s own volatility rises with its level, which is one reason level-based rules built on it need to be tested carefully.
What the VIX is not
Because the VIX is genuinely useful, it gets asked to do things it wasn’t built for. Three misconceptions worth clearing up.
It is not a forecast. The VIX is a real-time read of what the options market currently expects, not a prediction the market has committed to. A VIX at 30 today doesn’t mean volatility will be 30 annualised over the next month; it means options were priced this morning as if that were a reasonable guess. Reality often disagrees, sometimes wildly.
It is not a direction call. A high VIX does not mean the market is about to fall. It means the market expects large moves. In practice these often are down moves — sellers pay up for downside protection more than buyers pay up for upside — but there is no direction encoded in the number itself. Some of the sharpest VIX spikes on record have arrived after the big down day, not before.
It is not a market-fear thermometer. The VIX measures one specific thing: 30-day implied volatility on one specific index in one specific market. That’s one slice of fear. Fear about a slower shock (three-month, six-month horizons), fear in European equities, fear in fixed income or currencies — the VIX sees none of it.
Where the VIX shines — and where it falls short
Where it shines. The VIX has genuine strengths that have kept it the reference tool for decades. It is calculated the same way every day using a published methodology, so historical comparisons across years are meaningful. It reads the collective bet of a very large pool of professional and institutional participants — the price of protection in a deep options market is a hard signal to fake. And for the specific job it was built to do — read short-horizon expected volatility on the S&P 500 — it does the job well.
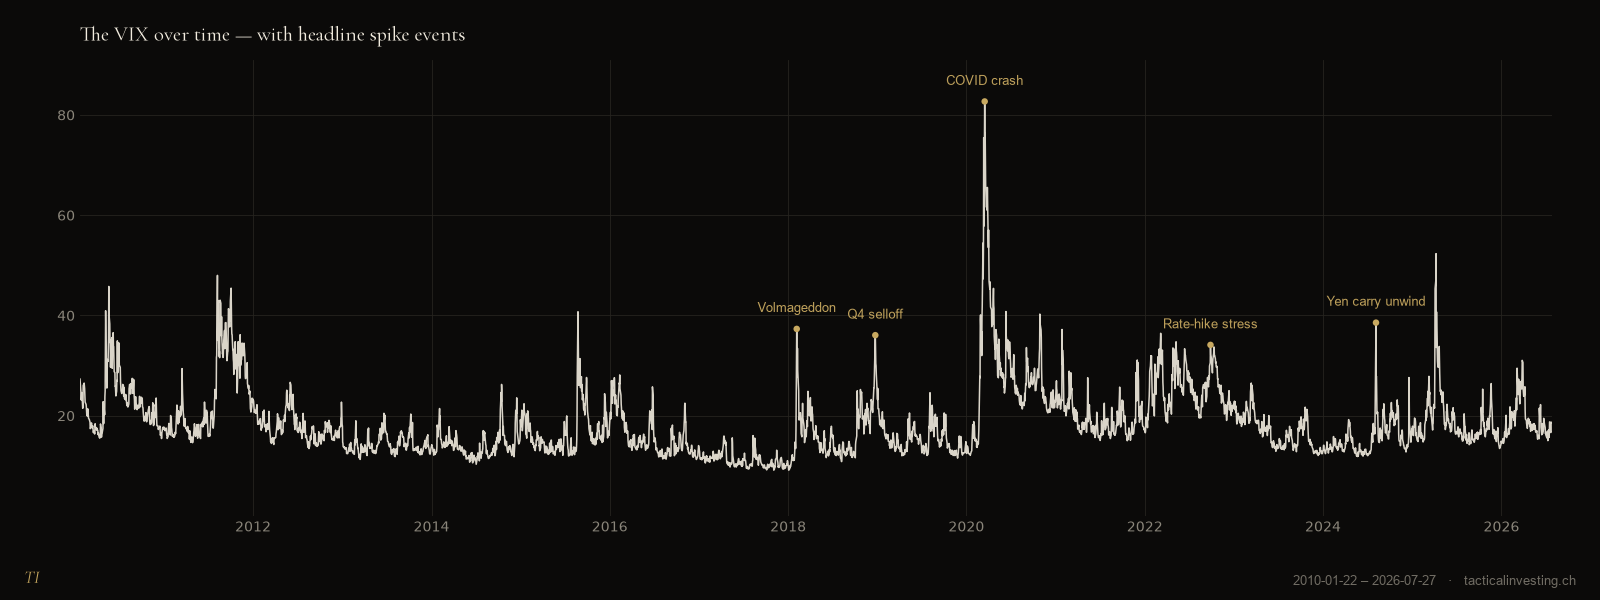
The VIX from 2010 to today, with headline spike events marked. The COVID crash of March 2020 remains the highest close in the series.
Where it falls short. The same specificity that makes the VIX clean also makes it partial. It looks at one horizon — 30 days — so it can’t tell you whether current stress is expected to fade quickly or drag on for months. It looks at one market — S&P 500 — so European stress, credit-market stress, or FX stress leaves no fingerprint. And it looks at one shape of fear — implied volatility — while missing the informational content of the volatility term structure, which is what practitioners actually read when the VIX is quiet on the surface but stress is building further out.
This is why serious volatility analysis rarely stops at the VIX. The full picture usually includes at least the VIX9D (9-day), the VIX3M (3-month) and the VIX6M (6-month) — reading the slope between them (contango or backwardation) tells you whether the market’s near-term nerves are elevated relative to the longer view, or the reverse. A VIX quiet at 15 while VIX3M is at 25 is a different regime from a VIX at 15 with VIX3M also at 15 — but you’d miss the distinction if you only looked at the headline number.
Beyond the VIX
The VIX is a genuinely useful signal — the best short-horizon volatility read available for free — and any serious market watcher should know how to interpret it. What it isn’t is a complete measure of market fear. A fuller signal reads the whole volatility term structure (not just one horizon), looks across markets rather than staying US-only, and combines those inputs into one calm-to-stress number that stays interpretable in real time. That is the shape a purpose-built fear index takes — and the reasoning behind the Tactical Investing Fear Index, which is the direction the companion post what a fear index is and how market fear is measured develops in detail.
For most retail investors, though, the immediate win from understanding the VIX is simpler: the next time it spikes into the headlines, you’ll know what the number is actually saying — expected short-term volatility in one market — rather than reading it as a forecast of doom. That alone changes how you interpret the news.
The takeaway
The VIX is a specific tool that does a specific job well. Read it as what it is — a real-time read of 30-day expected volatility on the S&P 500, derived from what investors are paying for options — and it will inform how you understand the market. Read it as a crystal ball or a complete fear-signal and it will disappoint you, not because the tool is broken but because you’re asking it the wrong questions.
If you’d like to understand how a broader fear measure is built — one that reads the volatility term structure and separates US from European stress — what is a fear index and how market fear is measured is the natural next read. And if you want to see the practical use of a fear signal in a rule-based strategy, three example strategies for different risk profiles shows what that looks like end-to-end.
For educational purposes only — not financial advice.