What Is a Fear Index? How Market Fear Is Measured
Markets don’t only move on facts — they move on fear. When uncertainty rises, prices swing harder and investors start acting on emotion rather than on a plan. A fear index is an attempt to make that emotion measurable: to turn the market’s collective anxiety into a single, trackable number. This post explains what a fear index actually measures, how the best-known one — the VIX — works, and how a fuller index like the Tactical Investing Fear Index goes further (and why it isn’t the same thing as CNN’s Fear & Greed Index).
What a fear index actually measures
At its simplest, a fear index turns market fear into a number. Most are scaled so that a low reading means calm and a high reading means stress — the higher the number, the more nervous the market.
Crucially, a fear index measures expected turbulence, not direction. It doesn’t tell you whether prices will go up or down; it tells you how violently they are likely to move and how anxious investors are right now. A high reading means the market expects a bumpy ride — which can still resolve either way.
This is also why a fear index is, in effect, a way to read the market’s regime. Markets tend to move through phases: long stretches of calm, where volatility is low and trends are steady; transitional periods, where stress is quietly building; and outright crisis regimes, where fear spikes and the usual relationships between assets break down. You normally only recognise these phases clearly in hindsight. A fear index tries to make the current regime visible in real time, by compressing all that nervousness into one figure you can watch day to day.
It’s worth being clear about the limits, too. A fear index is a real-time read of conditions, not a crystal ball. A calm reading is not a promise that nothing will go wrong, and a high reading is not a guarantee that markets will fall — fear can subside as quickly as it arrived. What the number gives you is an honest description of the weather right now, not a forecast of tomorrow.
The VIX — the original “fear gauge”
The most famous fear index is the VIX. Created by Cboe, it measures the market’s expectation of how much the S&P 500 will move over the next 30 days, calculated from the prices investors are paying for S&P 500 options.
The logic is intuitive. Options work a little like insurance: when investors are worried, they pay up for protection, and those richer option prices push the VIX higher. When investors are relaxed, demand for protection falls and the VIX drifts lower. So the VIX rises when fear rises and falls when calm returns — which is why the financial media nicknamed it “the fear gauge.”
The VIX is genuinely useful, and it’s the reference point almost every other fear index is compared against. A fuller walkthrough of what the VIX actually measures, how to read the numbers, and the specific things it does and doesn’t do is in the VIX explained — what the fear gauge really shows. But it is also a single number, describing a single market, over a single horizon — and that turns out to leave a lot out.
Beyond the VIX
A 30-day volatility reading on US stocks captures one slice of market fear. It says nothing about whether that fear is concentrated in the next few days or stretched over the coming months, and nothing about Europe.
A fuller fear index widens the lens. Instead of one volatility number, it reads the whole term structure — short-dated, medium-dated and longer-dated volatility — to judge whether stress is immediate or distant. It looks at the shape of the volatility-futures curve (whether near-term fear is unusually high or low relative to later months), and it can track a separate gauge for European markets rather than assuming the US tells the whole story.
This is the approach behind the Tactical Investing Fear Index. There are in fact two of them — one for the US and one for Europe — each built the same way: rather than rely on a single figure, each Fear Index blends several volatility signals from its own market into one calm-to-stress reading, so the number reflects the structure of fear, not just its headline level. The chart below shows the US index.
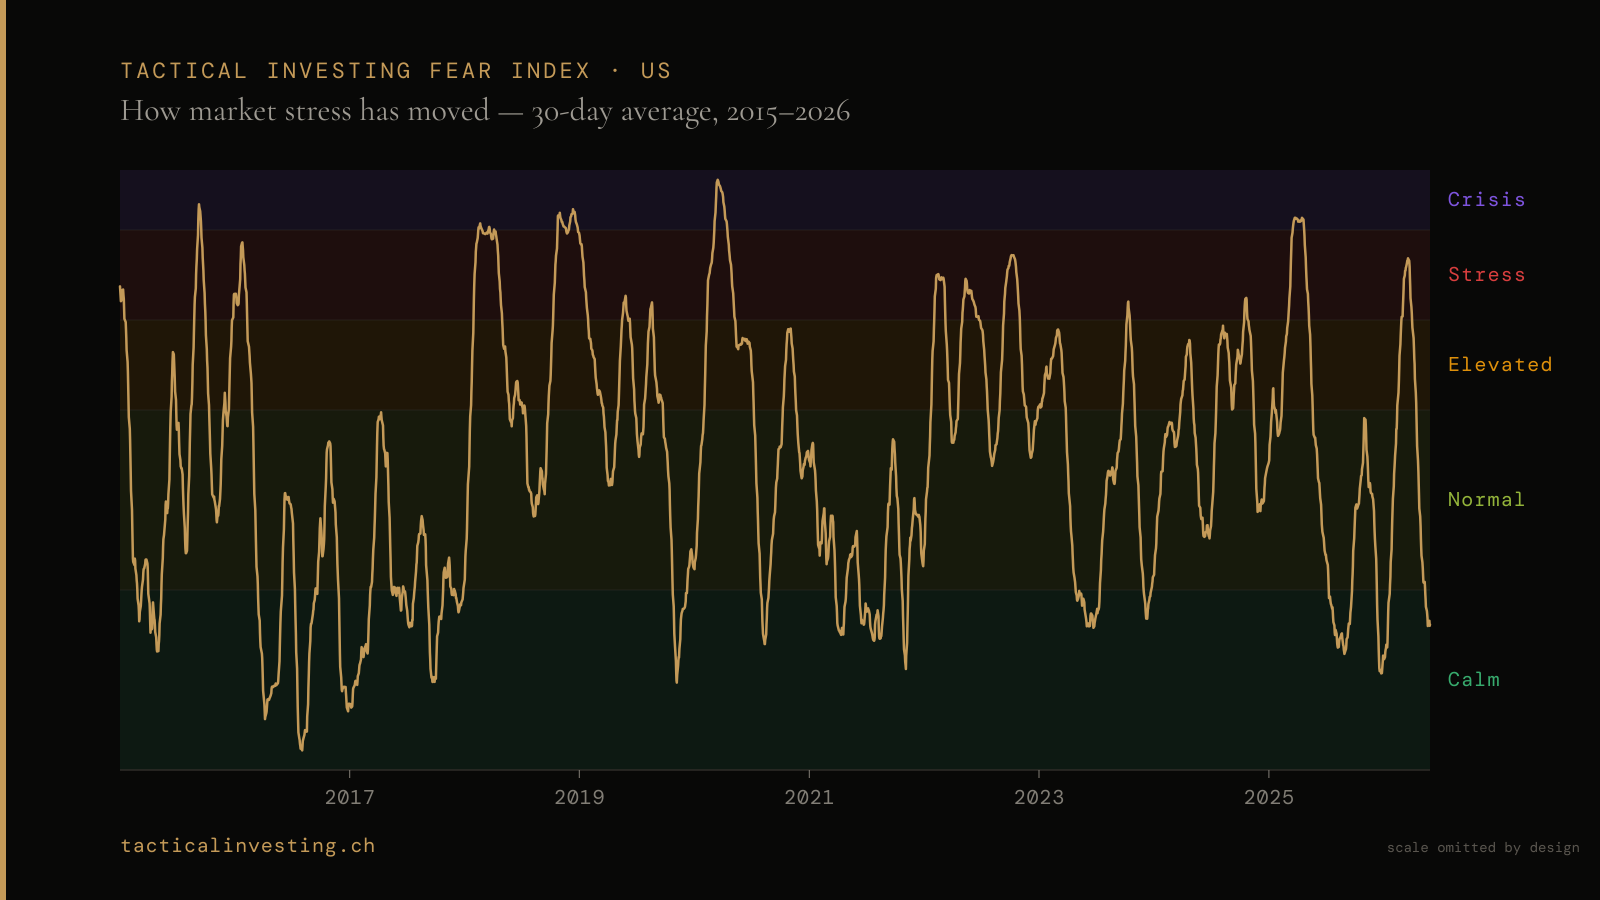
The US Fear Index over more than a decade — shown as a 30-day average. The vertical scale is intentionally omitted.
How it differs from the VIX and CNN’s Fear & Greed Index
Because “fear index” is a loose term, it’s worth being clear about what is — and isn’t — being measured.
- The VIX is a single volatility number: one input, one market, one 30-day horizon.
- CNN’s Fear & Greed Index is something different again — a sentiment gauge built from seven indicators of US stock-market mood (things like price momentum, market breadth and demand for safe havens). It is a well-known, separately published index with its own methodology.
- The Tactical Investing Fear Index is an independent, proprietary index — with separate US and European versions. It is not the CNN Fear & Greed Index and shouldn’t be confused with it.
At a high level, each Fear Index is built from its market’s volatility term structure and the shape of the futures curve, combined with several sub-signals into a single calm-to-stress reading. The exact weighting and formula are proprietary — but the principle is simple: read the whole shape of market fear, not one number, and express it as one figure you can actually act on. And unlike a general-purpose gauge, it is tuned for exactly that: designed as a signal you can trade and hedge on through rules you set in advance — not just a number to watch.
Why a measurable fear signal helps
A number on its own changes nothing. Its value is that it gives you something concrete to build a rule around — before you are under pressure. Instead of deciding how to react in the middle of a sell-off, you can decide in advance: “if the Fear Index moves above the level I’ve chosen, here is how my portfolio should shift.” That is exactly the kind of pre-commitment that helps you avoid panic selling.
It matters because different asset classes behave differently depending on the regime. In calm, risk-on conditions, equities often lead. In high-stress, risk-off conditions, more defensive holdings — gold, long-duration treasuries, cash, or volatility hedges — have historically tended to hold up better (though never with any guarantee). Each of those hedges has a regime where it shines and a regime where it bleeds — we go through the trade-offs in when hedging actually pays off. A measurable fear signal lets you map those regimes to your own plan: what to favour when the market is calm, and what to rotate toward when fear rises.
The signal doesn’t make the decision for you. You define the rules, the thresholds and the assets; the Fear Index simply tells you, in one honest number, which regime you appear to be in. If you’d like to see how that looks in practice, how to build your first strategy in PortfolioLab walks through it step by step. Whether acting on it is worth it at all — versus simply buying and holding — is its own debate, which we cover in buy-and-hold vs. tactical investing.
For educational purposes only — not financial advice.