The Real Growth Engine: I Tested 5,000+ ETFs in the Calm Years
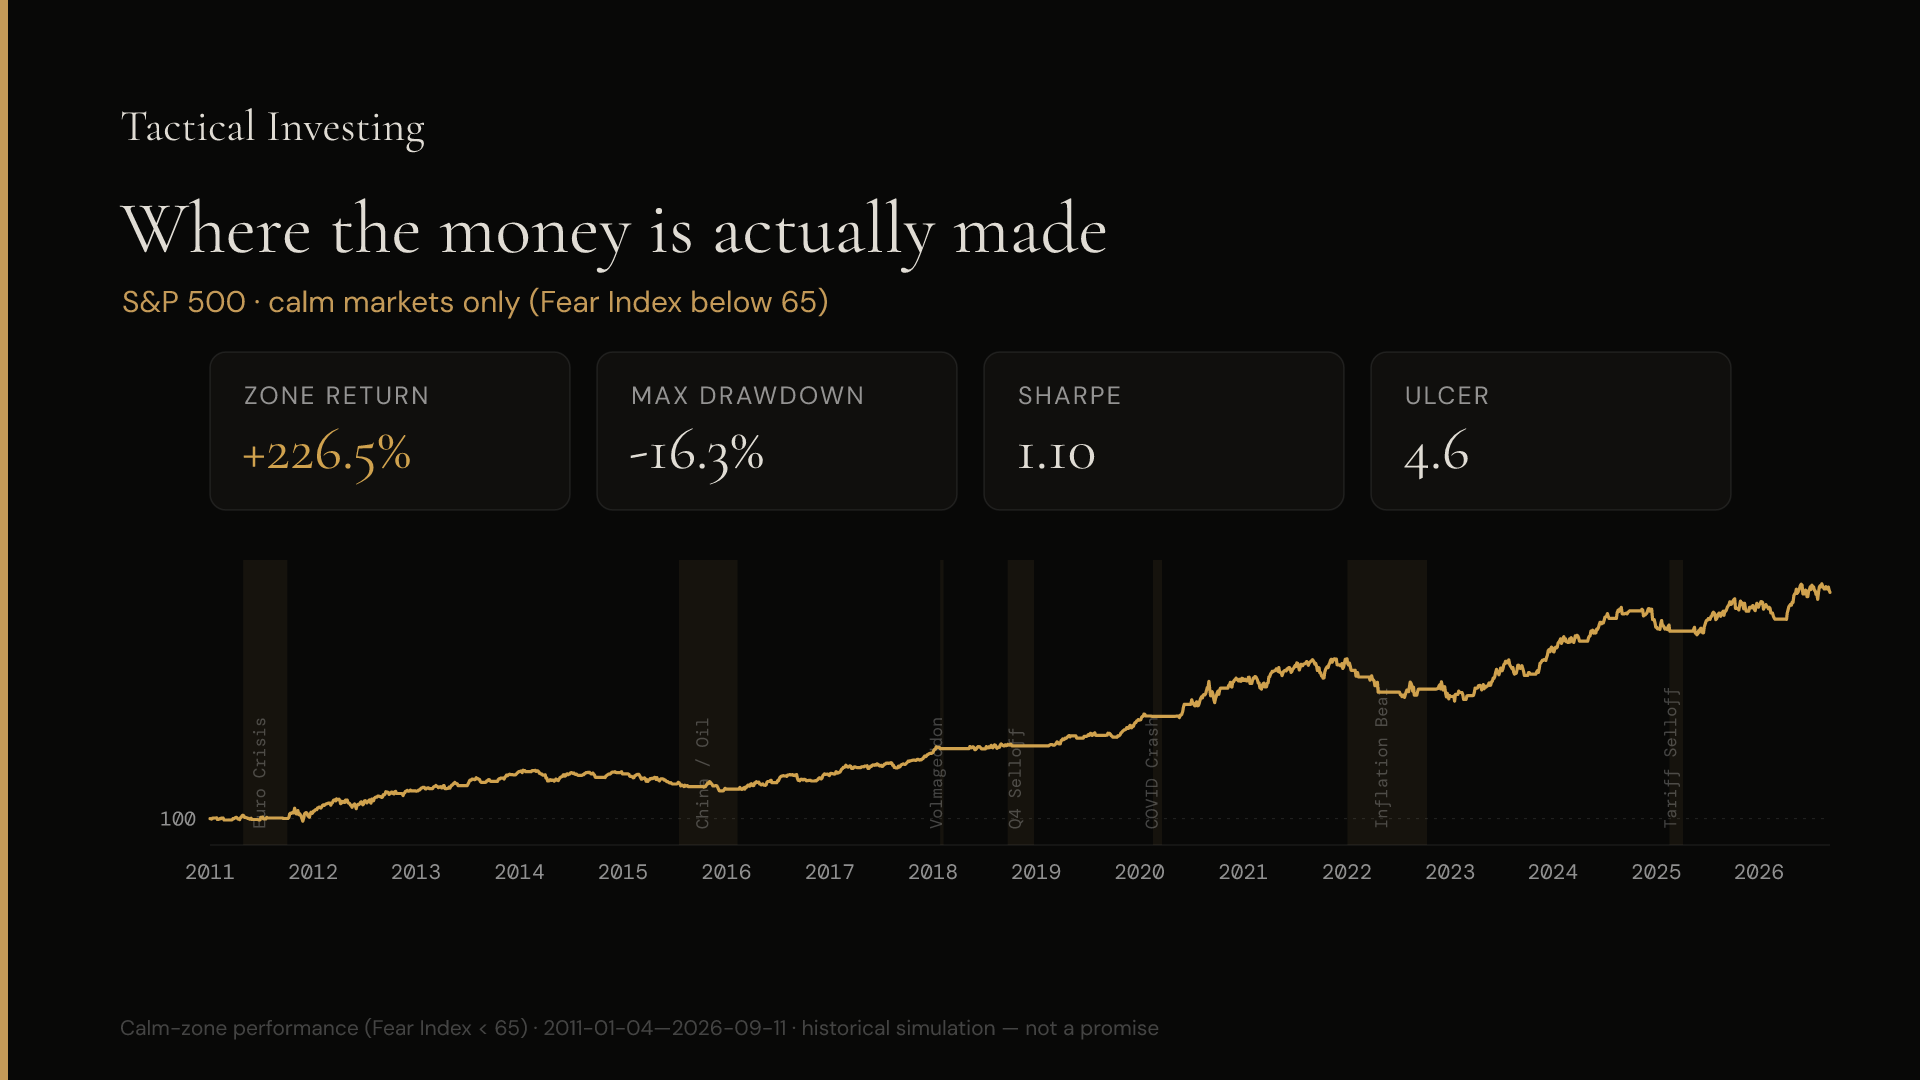
Everyone talks about the crash. “Growth stocks are risky, they’ll fall 50 percent.” And sure, they can. But that fear makes you miss the real point: the crash is rare. The calm years are where your money is actually made. That’s the engine — and almost nobody asks the real question. How hard should you run it? This is the written companion to the video.
Maybe you kept it safe and boring and watched tech run without you. Or maybe you’re all-in on the hot stuff and quietly bracing for the day it turns. Both are the wrong question.
The calm years are the engine
Think of the market in three weathers. Rare storms — real crashes. Some noisy in-between days — nervous, but usually harmless (I covered those in the last post). And then, most of the time, calm days. About two out of every three trading days sit in that middle band where the market just does its ordinary compounding.
Two out of three days is where your outcome is actually decided. Not the drama of the crash. Not the noise of the nervous stretches. The calm middle. The question isn’t “how do I dodge the crash.” It’s “which engine gives me the best return in the calm years — at a drawdown I can live with?”
What I actually tested
The rule for this one is deliberately narrow. No “switch to safety.” No tail hedge. No defensive tilt. Just one question: in the calm days, which fund gives you the best return at a drawdown you can actually hold through? Defensive and tail-risk moves were the last two videos; whole strategies are too complex — that’s for later. This one is pure engine-testing.
Same signal, same fifteen years, every fund — measured only on the calm days.
One tournament, 5,000+ funds
I didn’t pick a few favourites. I took every U.S. fund I could get — the whole tradable market — and ran the same test on each one. Total return, worst drop, return-per-drop, and how much slow pain the drop-and-recovery cost you. Then I ranked them.
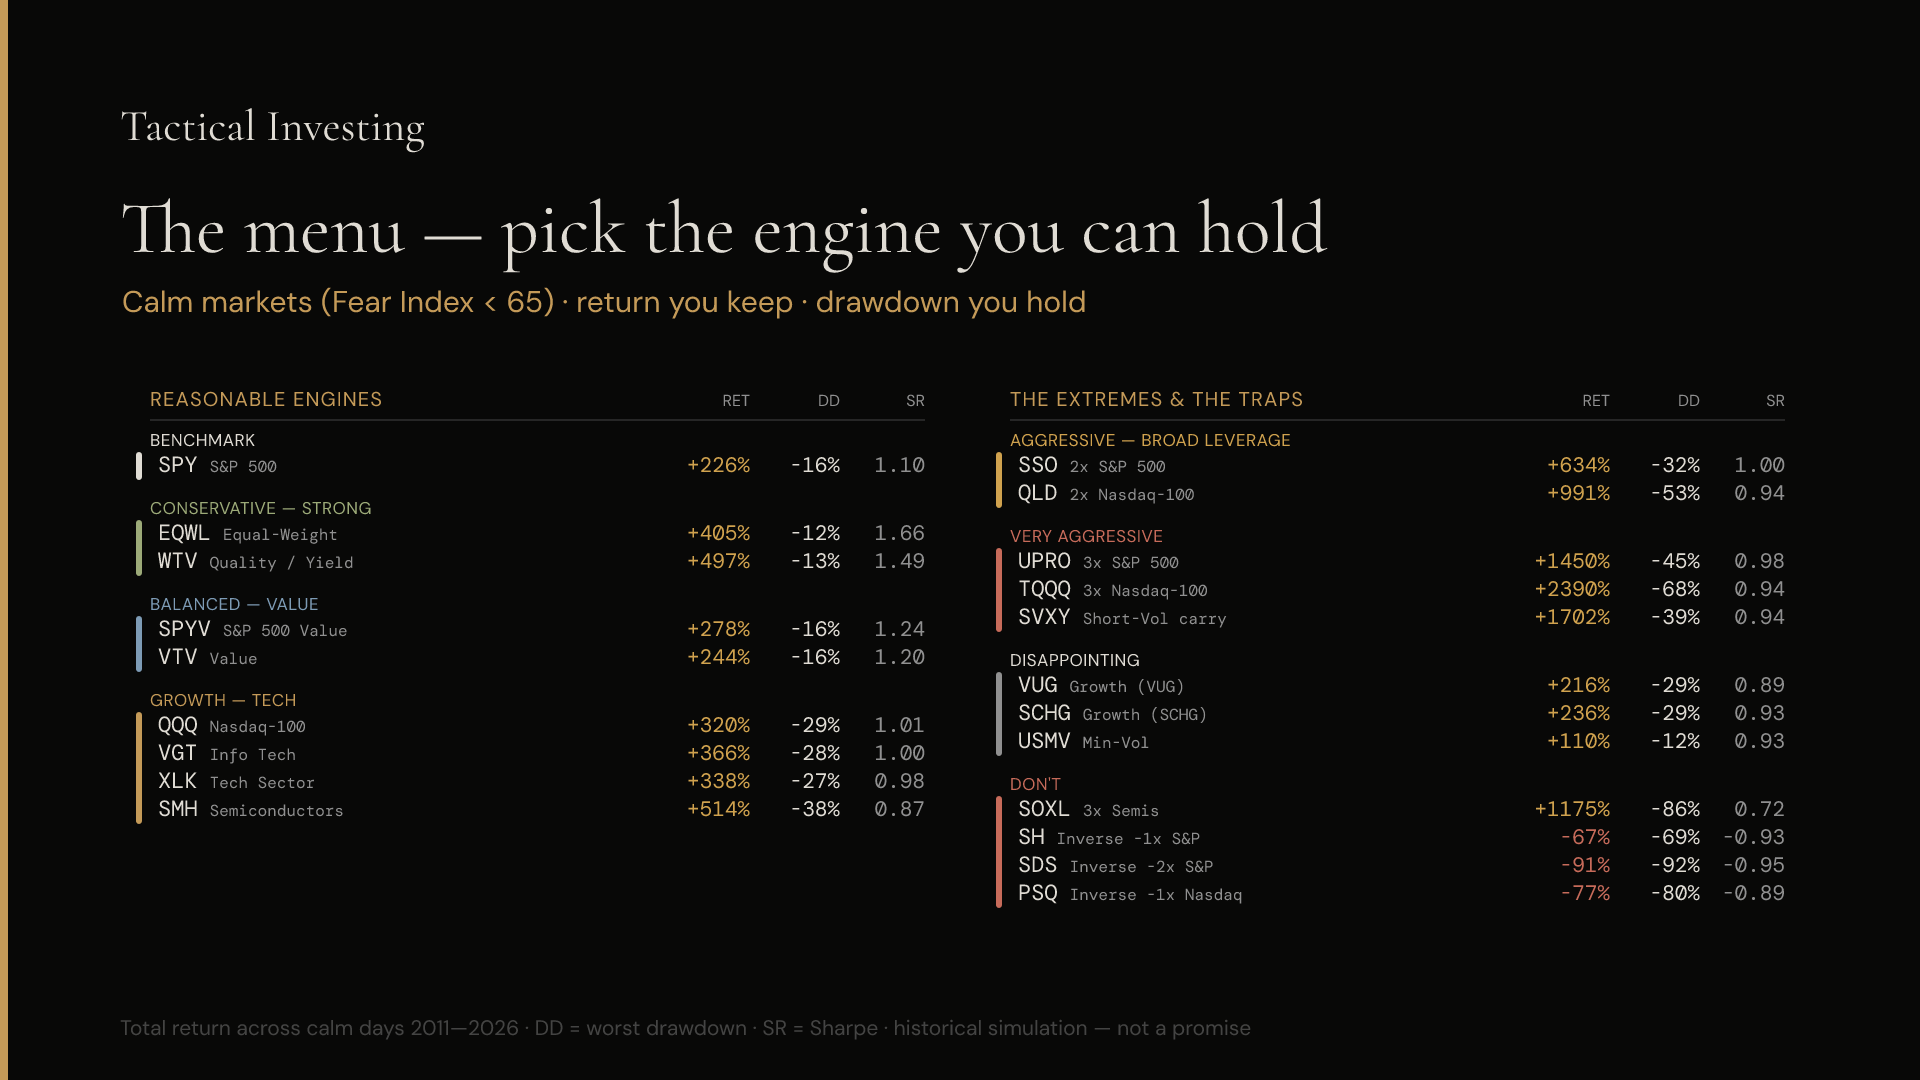
An honest caveat before the verdicts: this is a survivorship-aware sweep across everything currently tradable. Funds that got closed along the way aren’t in the record, and that mildly flatters the average. The winners below are still the winners — just don’t read “the average fund” as safer than it was in real time.
Three counter-intuitive verdicts
Start with what everyone will tell you to buy for “growth”. Ranked side by side, the labels lied more than they helped.
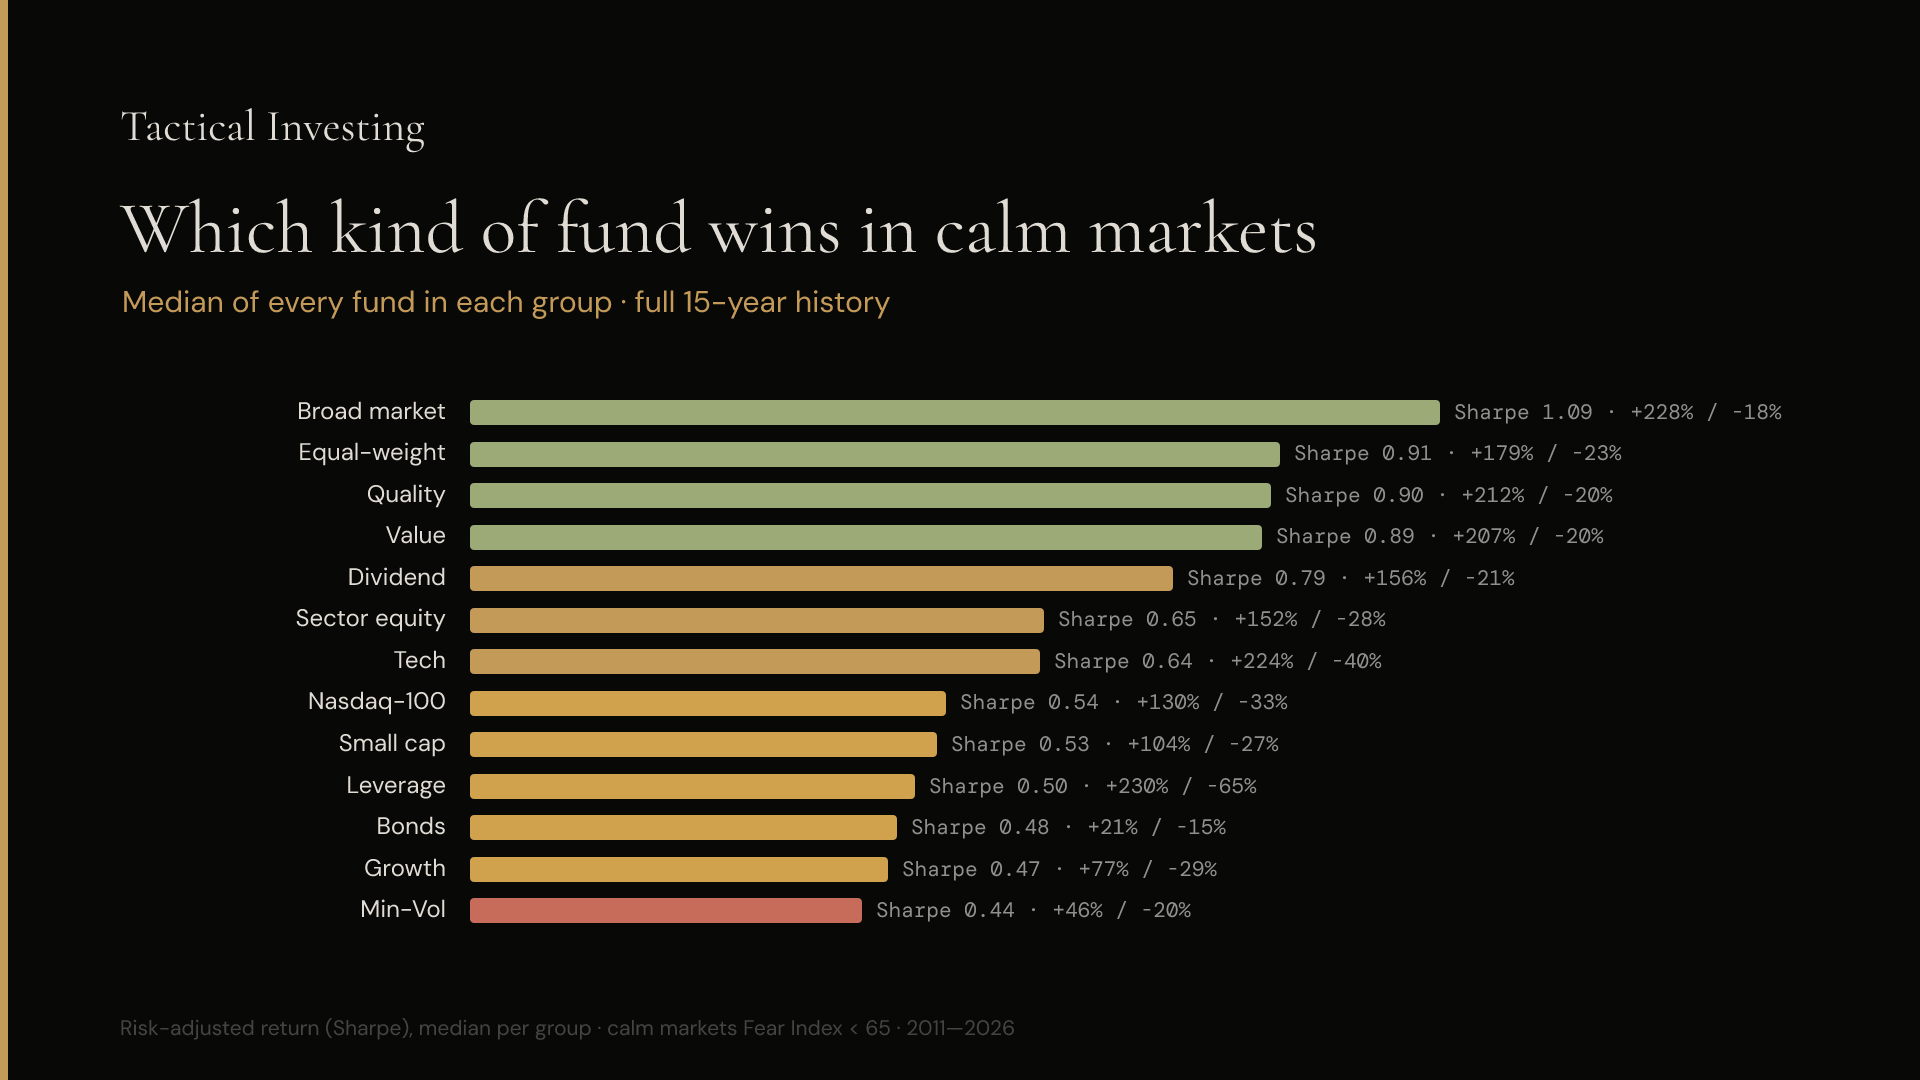
1. “Growth”-branded funds lost to the plain S&P. The average fund with “Growth” on the label made less than a plain S&P index (about a third less over fifteen years) — and got there with nearly twice the drawdown. The label picked up what was already yesterday’s winner; the index kept picking up tomorrow’s.
2. “Low-volatility” funds are the wrong engine. They sound like the safe way to grow — steady, boring, less scary. Measured across calm days, they made about half the return of a plain index for a barely gentler ride. The right medicine for the wrong illness: low-vol works in the crash zone, not in the two-out-of-three years the engine actually runs.
3. Inverse funds bleed even when they aren’t wrong. Every “short S&P” and “short Nasdaq” fund in the sample lost money in the calm years — most of them by more than 90 percent. Compounding against you is a slow, guaranteed loss.
The pattern: the more clever the tilt, the worse the outcome in the ordinary years. What actually beat the S&P was almost embarrassingly plain.
What actually held up: three quiet engines
The winners weren’t the aggressive tilts, and they weren’t the defensive ones. They were the plain, patient, own-the-market choices — with one small twist each.
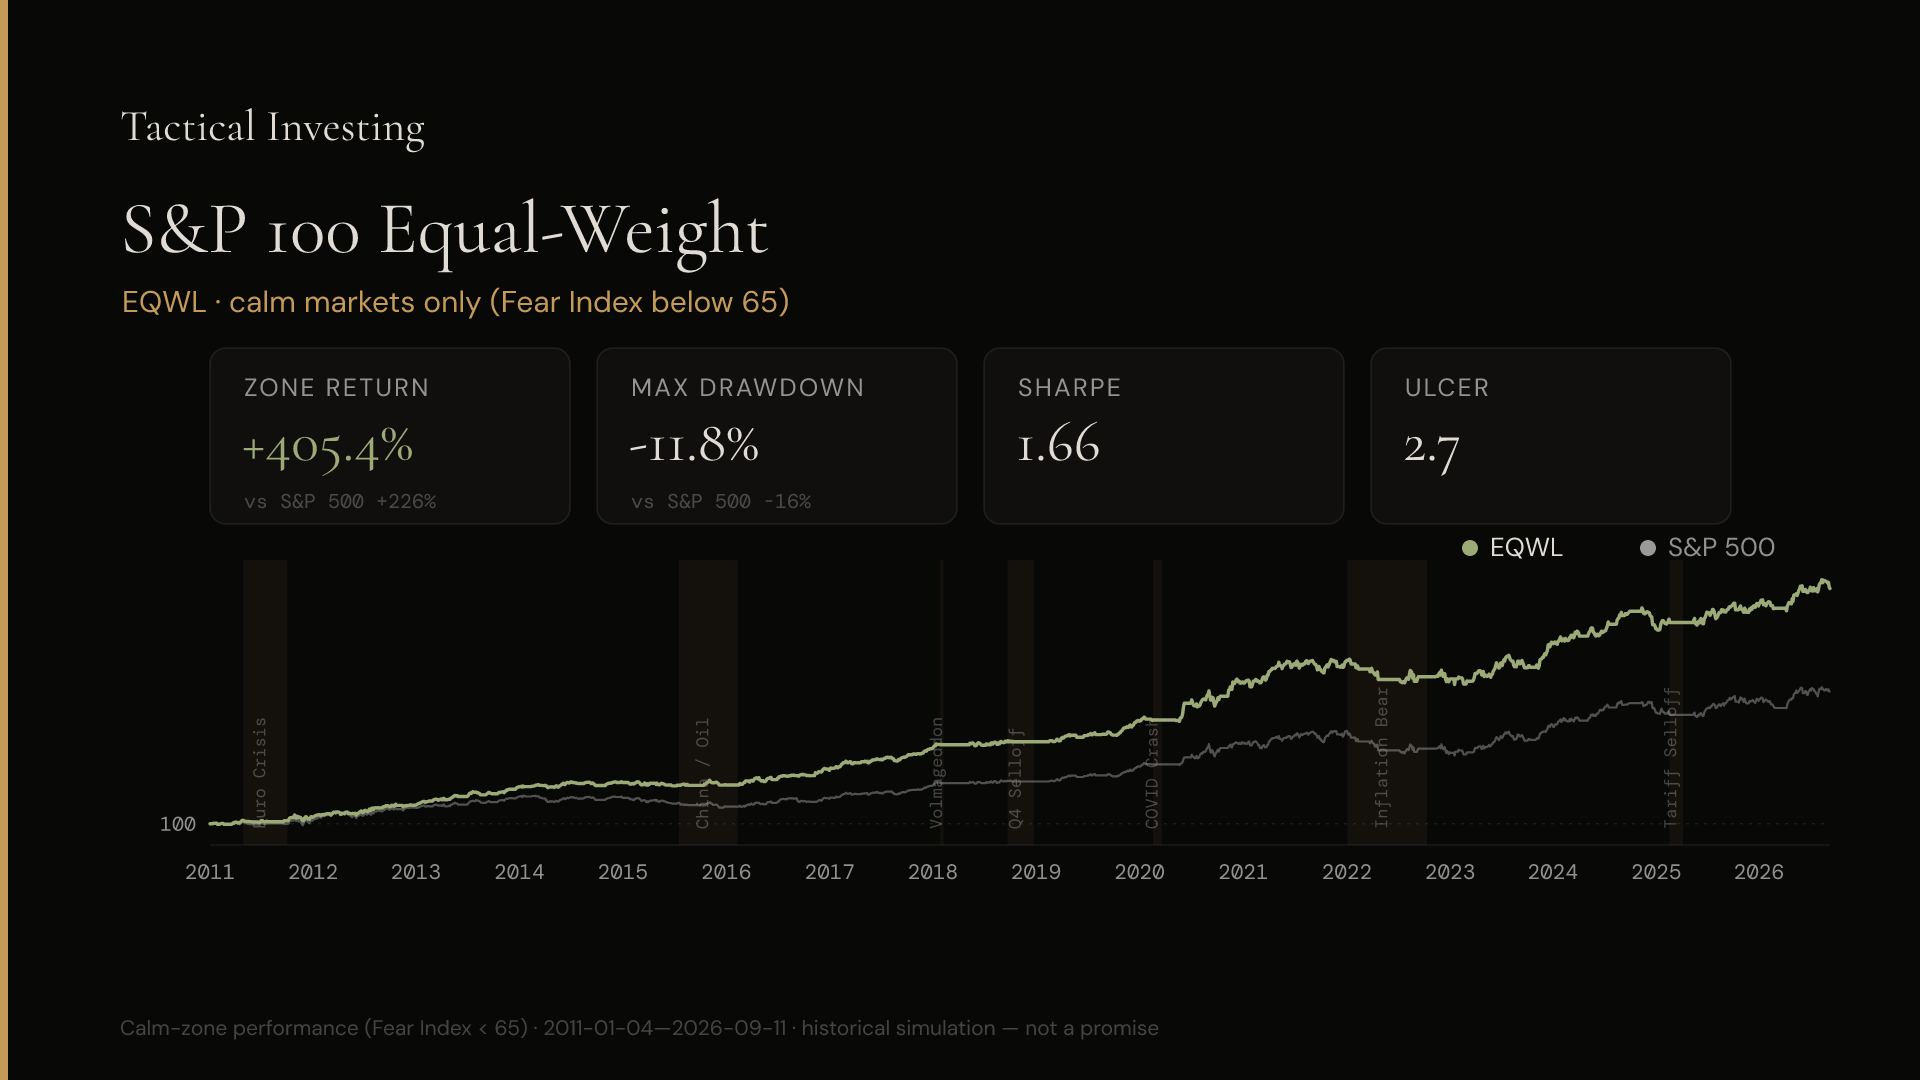
1. Equal-weight S&P (EQWL) — the same 100 large-cap stocks, just weighted equally instead of by size. Same universe, different math.
2. Value (WTV) — a straightforward US quality/value ETF. Boring on the label, quietly the best return-per-drop in the whole population that lived through the full fifteen years.
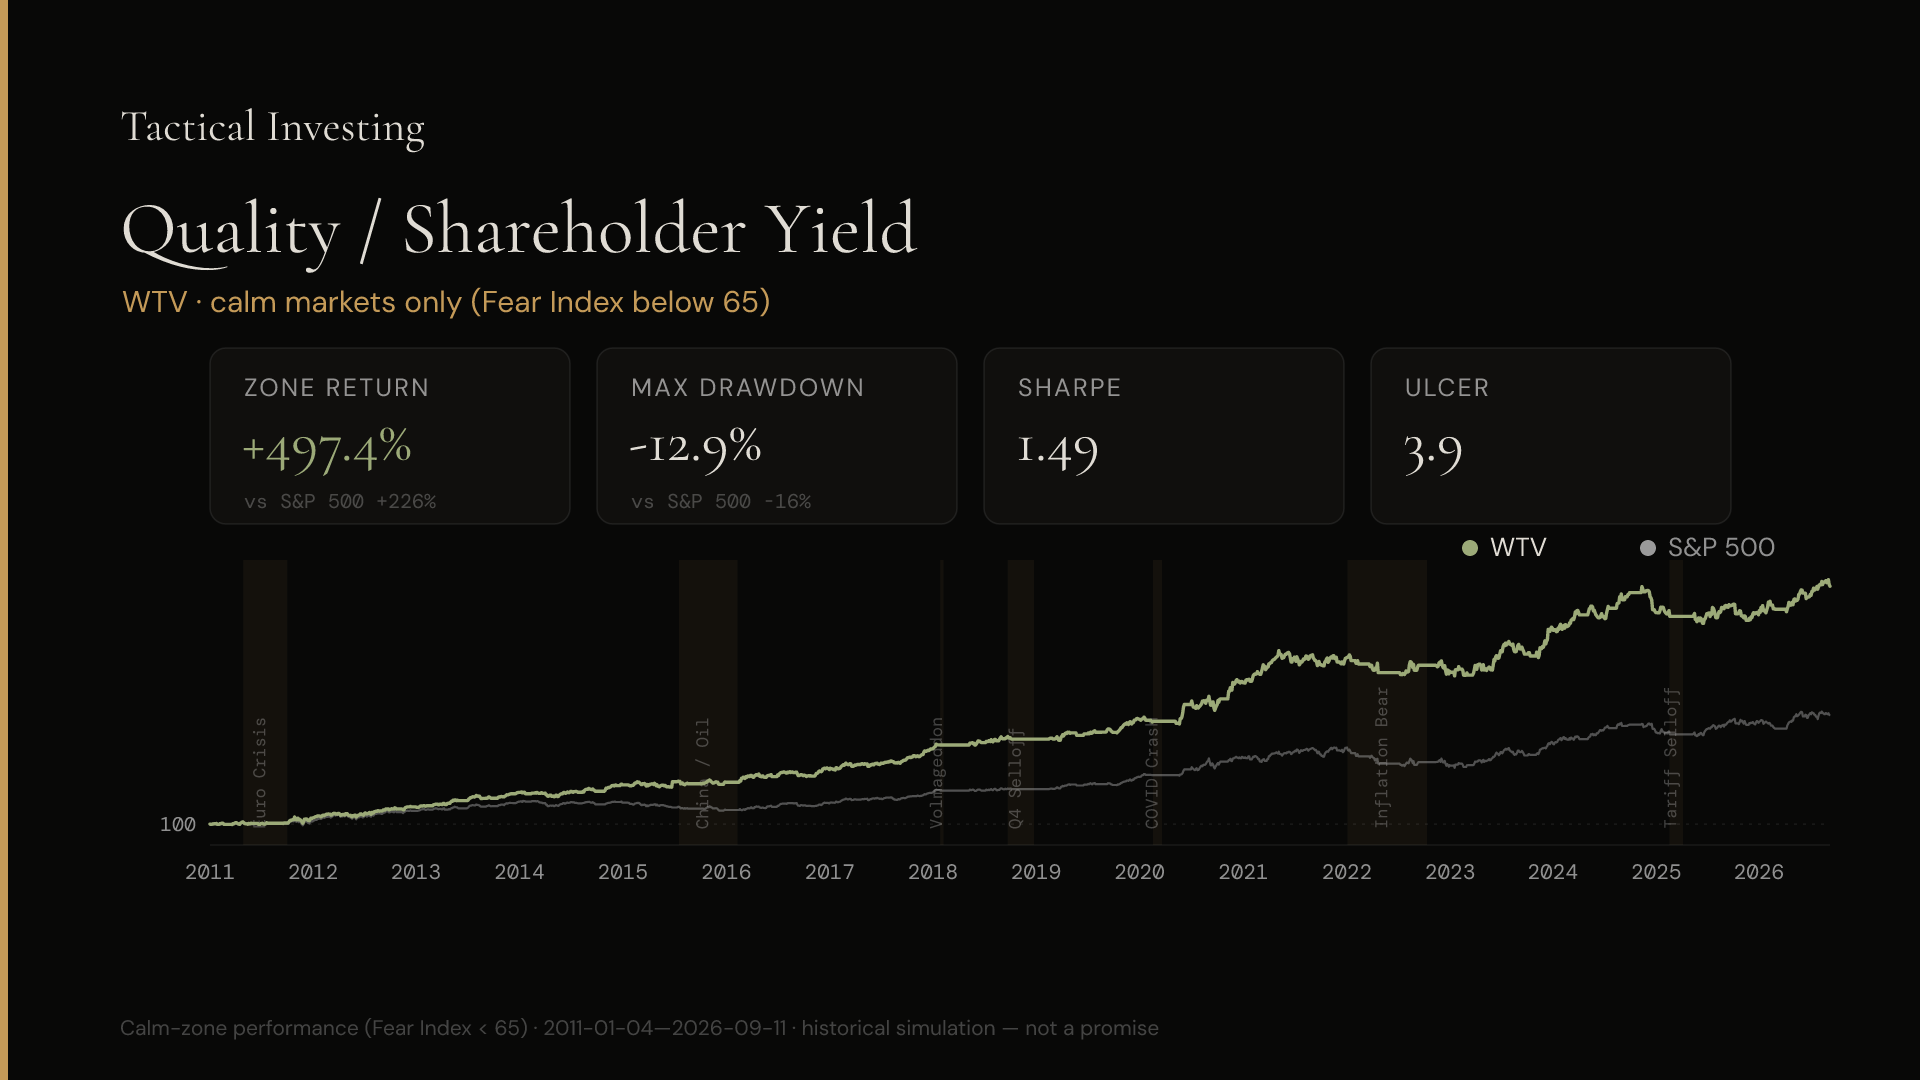
3. 2× S&P (SSO) — the honest way to lean in. Not sector-leverage (which blew up whenever the sector went off-cycle), not 3× (which needs a stomach not everyone has). Just the broad index, twice.
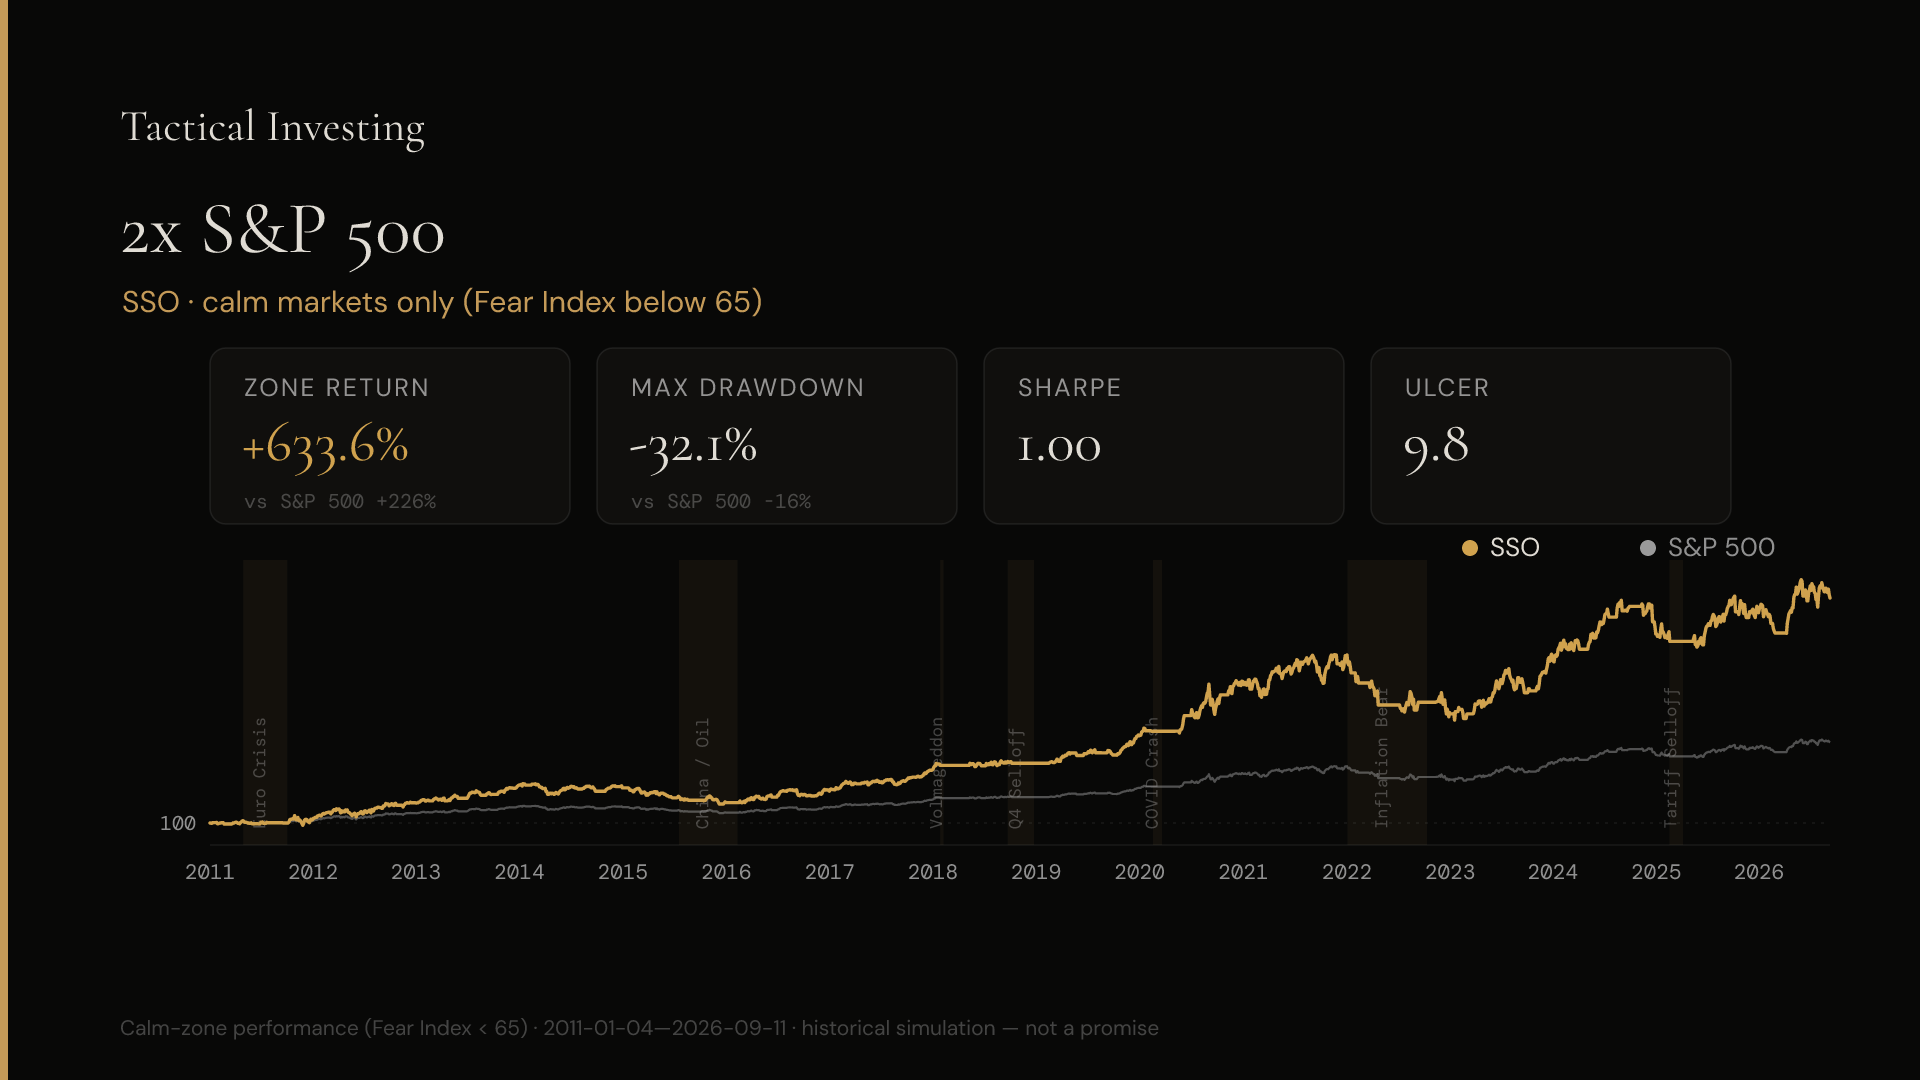
Same road. Different engine. Pick the one you can hold.
Yesterday’s rocket, tomorrow’s dud
A caveat that matters more than any single winner. Some of the biggest numbers on the leaderboard belong to funds that made most of their return in one era and then stopped. Triple-leveraged Nasdaq (TQQQ) compounded at 55 percent a year until 2020, and at 18 percent a year since. Triple-leveraged semiconductors (SOXL) went from 49 percent a year to under 6.
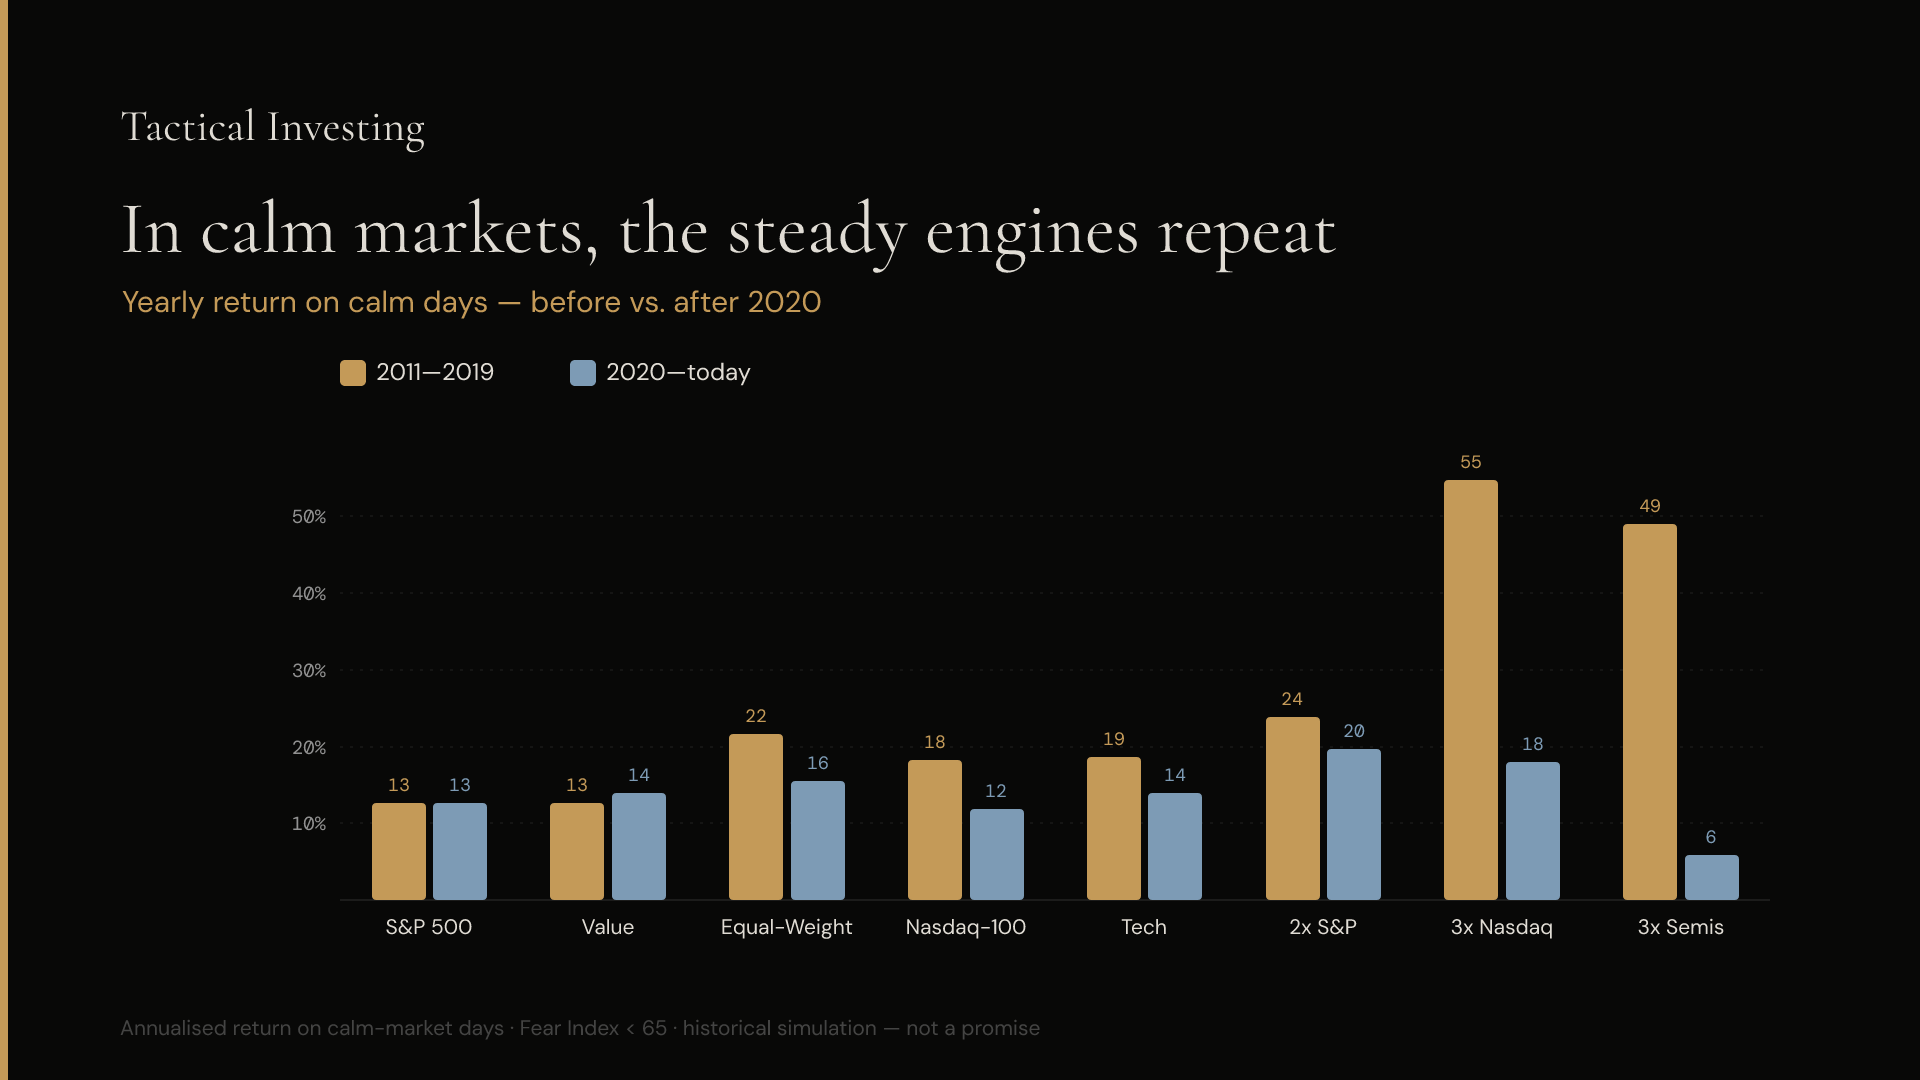
The lesson isn’t “avoid leverage” — SSO on the broad index kept its edge. The lesson is: the more concentrated the fund, the more its record depends on one era. A number from 2011–2019 is not a promise of 2020–2026, and the leaderboard punishes people who forget that.
The takeaway
Two out of three days are calm. Not exciting. Not scary. Just the market doing its ordinary work. What actually wins in those years is not the “growth” label, not the low-vol pitch, and definitely not the hedge. It’s the plainest own-the-market choices with one small tilt — and, if you can hold it, the honest broad leverage that just multiplies the same ride.
If I had to compress fifteen calm years into one sentence:
Test every engine. Pick the one whose drawdown you can hold. Then leave it alone.
Every fund I tested — search yours
One honest note before the table. Read both numbers, not one. Performance is what the fund did during the calm days themselves — the two-out-of-three days when the market is quiet — compounded across fifteen years. Max DD is its worst drop within those same days. The bigger the return, usually the deeper the drop — the whole point of the exercise is finding the pairs that broke the trade-off.
Only funds with at least eight years of history are listed — enough to have compounded through several full calm-to-nervous cycles. That leaves 1,503 funds out of the 5,223 tested. Leveraged and inverse products are hidden by default; the menu lens above the table presets the sort and toggle for your risk profile — Conservative sorts by shallowest drop first, Balanced by best return-per-drop, Aggressive by biggest total return with leverage back in.
Why measure it at all
The point of the video — and this post — isn’t to hand you a fund. It’s to give you a way to check the folklore yourself. Ask an AI on its own and you’ll get the reflex answer: “growth is up-only, low-vol is safe, hedge with inverse.” Give it a way to actually measure every calm stretch of the last fifteen years, the same way, and you get the honest, awkward answer instead.
You don’t have to take my word for it — you can run this exact idea yourself on your own rules and your own instruments. That’s the whole idea behind this series.
Test it. Don’t trust it.
For educational purposes only — not financial advice.